Tag Archive for: consumer behavior

A new survey sheds some light into the real reasons why consumers like, share, and follow brands on social media.

As Yes Marketing reports, their survey of 1,000 consumers reveals:

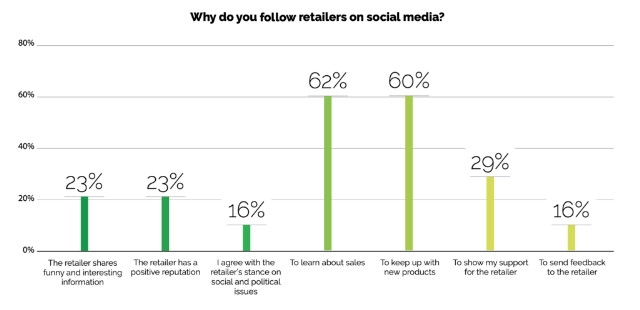
  • 63% of consumers follow retailers on social to learn about sales.
  • 60% follow retailers to keep up with new products.
  • 29% follow to show support for the retailer.
  • 23% follow because the retailer shares funny and interesting information.
  • 23% follow because the retailer has a positive reputation
  • 16% follow because they agree with the retailer’s stance on social and political issues.

When it comes to specifically why customers engage with content from retailers on social media, here’s what people had to say:

  • 36% engage with content because the retailer promises a discount for sharing the post.
  • 36% engage in order to share a product update or sale with their followers.
  • 35% engage because they agree personally with the content of the post.
  • 30% engage because the post is funny or interesting.
  • 29% engage in order to share positive feedback with the retailer.
  • 20% engage in order to share negative feedback with the retailer.

As for which demographics are active on which social networks, the respondents broke down as follows:

  • Gen Z consumers are more likely to have YouTube (77%) and Instagram (77%) accounts than a Facebook account (74%).
  • Millennials (89%) and Gen X (88%) are most likely to be on Facebook.
  • More Gen Z consumers (56%) are on Twitter compared to Millennials (50%) and Gen X (39%).
  • Snapchat is the least used social network among all respondents (30%), followed by Twitter (36%).
  • Only 11% of respondents are not on any of the major social networks.

Get the full report here to learn more.

A new survey of US consumers has some surprising findings about what customers expect out of business websites.

The results from 1,013 respondents between the ages of 18-60 show that consumers have high expectations when it comes to how frequently your website is updated, what features are implemented, and how you are advertising your business online.

What Consumers DON’T Want in a Website

Of the respondents, more than 80% say they view a brand more negatively if their website is out of date. Additionally, 39% of consumers say they would reconsider buying a product or service if the website isn’t current.

The issue of advertising is also a prickly subject for consumers, based on the survey results.

Less than 10% approved of brands showing ads on social media based on a person’s browsing activity. Meanwhile, approximately 26% feel negatively about ads appearing on their social media feeds based on their browsing or device history – saying it is an invasion of privacy.

On the other hand, 41% of consumers say they don’t mind if websites keep personal data, but only if it is secured on used exclusively to improve the user experience.

Overall, consumers are largely conflicted. Approximately 50% of respondents say that they like the convenience of brands keeping data for to improve ads and user experience, but they are concerned about how else it might be used.

What Consumers DO Want in a Website

In general, consumers say ease of use should be the top priority in making their online experience better.

Approximately 50% of the respondents said they prefer user-created content like reviews and photos to help inform their purchasing decision.

Meanwhile, 25% say their favorite website feature is receiving a reminder when they have left a product in their shopping cart.

Perhaps surprisingly, a major feature desired by users is an on-site search engine. Nearly one-third of respondents say they are put-off if a site does not have a search box, while more than 40% say a search box is the most important feature on a site.


The survey includes a number of interesting findings about consumer behavior and desires online covering a wide range of topics. You can read all the details from Blue Fountain Media here.


Everyone seems to be ripping off Snapchat’s style these days, whether it’s the spread of vanishing video or “Stories”. Still, it doesn’t seem to be impacting the platform’s popularity with their biggest demographic.

Teens still prefer Snapchat over any other platform – and it’s not even close.

The investment firm Piper Jaffray’s latest annual “Taking Stock With Teens” report surveyed over 6,100 people across 44 states. It specifically asked teens about their social media usage over the past month.

According to their results published on AdWeek, almost half (47%) of all teens said Snapchat is their favorite app. That’s an increase from 35% last year. The closest runner-up was Instagram, which was preferred by 24% of teens. Despite being the biggest social network, Facebook trailed with 9% of the vote. Lastly, Twitter and Pinterest picked up 7% and 1% respectively.

The report also includes a number of other interesting findings about teens’ media and shopping habits, including:

  • 82% of teens say their next phone would be an iPhone
  • 23% of teens prefer to shop at specialty retailers, with 17% saying they like pure-play e-commerce retailers
  • 49% of teens say their favorite website is Amazon, while 6% choose Nike.com and 5% prefer American Eagle’s website.

christmas-desk

A new study published by ad tech company Fluent shows the holiday season is looking to be more mobile than ever.

According to the report, nearly 40% of all US consumers are already planning to make at least one purchase this holiday season from a mobile device. Unsurprisingly, younger consumers appear to be more likely to make purchases from mobile devices compared to older individuals.

fluent-3-800x369

For the survey, the company asked almost 2,000 US consumers questions about their holiday shopping plans in late September. The responses showed 39% plan to make at least one purchase on a mobile device, with younger shoppers being increasingly likely to go mobile.

Just less than half of consumers between the ages of 18-44 say they plan to shop on mobile devices, compared to 33% of those 45-years-old or older.

fluent-1-800x363

The survey also provides insight into how consumers will be researching their purchases ahead of time, both online and offline. In total, approximately 54% will do the majority of their research online, while 47% will continue to do their research in traditional physical stores.

fluent-2-800x349

While online research is becoming a big part of the holiday season, brick-and-mortar stores will still be where shoppers are spending the majority of their money. The survey results show 78% of consumers will do at least half their shopping in stores, while 22 percent said they will do at least half their shopping online.

The survey shows a small discrepancy between genders, as well. Fluent says men are slightly more likely to research products online compared to women.

A new study by Blue Nile Research investigated search behavior and found some interesting trends that give insight into exactly how people are searching online and what they are looking for. Most notable among the findings are the discoveries that searches use question formats in 27% of queries, and are perfectly divided on searching in short form (under 4 words) or long form (4 or more words).

According to the findings of the study, 27% of searches phrased their search in the form of a question, using words such as ‘how’, ‘why’, ‘where’, ‘what’, and ‘which’ rather than a ‘statement query’.

bluenile-searches-question-format-800x424

When broken down, most question queries included the word ‘how’ (38%), followed by ‘why’ (24%), ‘where’ (15%), ‘which’ (12%), and ‘what’ (11%).

bluenile-searches-question-type

The study also finds that searchers are perfectly split when it comes to search length. The report shows that 50% of searchers break queries into so-called ‘fragment queries’ which contain 2 to 3 words, while the other half use ‘full queries’ which contain 4 words or more.

bluenile-searches-frag-800x442

You can read the full report from Blue Nile Research here.

Best-Android-phones-for-Christmas-2013Now that the holiday season is over, several companies including Target and Amazon are releasing statistics related to 2014’s holiday shopping. While there are several interesting facts to be found in the reports, Target’s release may have the most striking bit of information.

Target claims the majority of traffic to its Target.com website came from mobile devices throughout the holiday season, making it clear that mobile is quickly becoming the primary option for online shopping.

The company says, “Mobile traffic made up 60 percent of Target.com traffic November through December.” The press release also highlighted other mobile milestones for the company:

  • Black Friday weekend purchases made via mobile phones were 2 times higher than 2013
  • Cartwheel, Target’s digital coupon app, added 2 million new users over the holiday period and surpassed $1 billion in promotional sales since it launched
  • Target.com store-pickup orders hit a new record high on Thanksgiving Day
  • Store maps in Target’s new iPhone app were accessed more than 400 thousand times

Long-time mobile leader Amazon reported similar findings to Target, saying, “Nearly 60 percent of Amazon.com customers shopped using a mobile device this holiday. Mobile shopping accelerated as customers got later into the shopping season.”

Amazon also mentioned that Cyber Monday was the biggest mobile shopping day of the season, but Black Friday “had the most rapid growth in mobile shopping.” The company also reported that total sales of the Amazon smartphone app had doubled last year, which coincides with Amazon mobile entering comScore’s Top 15 US Smartphone apps list.

The latest “audience insights” report for Q2 of this year from NinthDecimal was released this week and the findings about shopping on mobile devices could have a big influence on how marketers think about on-the-go research and conversions.

The report shows that smartphones are quickly becoming the primary way users research retail purchases, which should be of little surprise. However, the findings also show that research on tablets has been significantly declining which may suggest a troubling future for the devices.

Retail Product Research

NinthDecimal says they believe the decline is due to increasing consumer comfort with shopping on smartphones, especially as screen sizes are increasing and NFC services like the newly launched Apple Pay make it easier than ever to shop on a smartphone.

Also unsurprising is the finding that consumers tend to conduct shopping-related research before they leave the home to shop, although in-store usage is also growing. The report also shows that the length of time that consumers spent researching a purchase before buying was directly tied to cost. Products under $50 saw an average of 10 days of research or less. Meanwhile products above $1,000 days got an extensive 45 days of research lead time on average.

Product Research Time

Of particular note to online marketers and businesses may be the data claiming that within the last month approximately 45 percent of consumers reported making a retail purchase after seeing a mobile ad. However nearly three-fourths of respondents said they were more likely to engage with retail-related advertising at home, before they began shopping.

Mobile Ad Response

According to the report, the types of ad content most likely to sway mobile users were (in order): product discounts/sales, reviews, product information, giveaways and store-location information

The report from the 3rd Annual U.S. Mobile Path-to-Purchase Study conducted by xAd and Telmetrics shows that as consumers mobile shoppers are increasingly receptive to relevant mobile ads, reflecting the increasing trust in mobile browsing.

The report, published earlier this week, shows that nearly 50 percent of mobile shoppers reported they felt mobile ads are informative or helpful, up 113 percent from 32 percent last year.

Even more, 40 percent of those surveyed said they have clicked on ads and nearly half of those have taken secondary actions such as viewing the referring website and searching for additional product information.

Clearly, mobile advertising is a blossoming target as the internet becomes increasingly mobile. In a market where mobile use has begun outpacing desktop access, it makes sense that users would become equally interested in relevant ads for their mobile devices.

You can get more information in the infographic shared below, or you can view the report in full here.

MP2P_2014_USR2_AdReceptiveness-305x1024

With each new study focusing on consumer behavior, smartphones are proven to be even more integral to our purchasing habits than many of us may realize. I think everyone is aware of the increased importance of smartphones and mobile browsing in the market, but it may still be surprising that the majority of consumers (up to 60 percent) exclusively rely on mobile for purchasing decisions within the categories of telecom, restaurants, auto, and entertainment.

Numerous analysts suggest the rise shown in the third-annual Mobile Path-to-Purchase report from xAd and Telemetrics could be partially caused by an increase in consumer satisfaction in mobile devices and tablets, both rising 2 percent from 2013. Smartphone satisfaction grew to 61 percent, with tablets increasing to 68 percent.

satisfaction-mobile-xad-telmetrics

According to the study, the most common reasons for dissatisfaction included not enough information, slow connection, or a small screen. While website owners can’t control the size of screen their users have, they can improve the amount of information on their site, increase load speeds, and optimize their design for smaller mobile screens.

More than 40 percent of consumers cited mobile as the most important media source for information as well. Print industry continues its march towards complete irrelevance as it was called the most important source by only 5 percent of those surveyed.

media-source-of-info-xad-telmetrics

The increasing relevance of smartphones in shopping habits continues, with smartphones showing a 26 percent increase from 2013, with 29 percent citing it as the most important shopping tool in 2014. A quarter of users also said they utilized mobile devices on the entire path to purchase, from research, to comparison, to conversion.

“Capturing consumer engagement points throughout the mobile path to purchase is essential to optimizing mobile ad programs to reach consumers when they are most open to options for fulfilling their purchase needs,” said Bill Dinan, president of Telmetrics.

SEO and online marketing have changed drastically over just the past couple years, especially with the rise of social media and huge changes to how search engines are able to analyze and rate websites for users. However, some things have stayed the same through it all, such as the importance of email marketing.

It could be easy to think that social media would usurp the place of email marketing in building a relationship between consumers and your brand by gradually letting potential customers see who you are and what you represent. However, you would be wrong as emails still hold their place by offering a direct line to interested users that even social media can’t match.

The majority of businesses realize this, judging by the continued prevalence of email signups and calls-to-action deliberately designed to get visitors onto an email list. What some of those companies may not understand is that they may be missing out on some of the potential of their email list by marketing to the wrong device.

A new report from Movable Ink’s Q1 2014 US Consumer Device Preference Report shows that email opens are continuing to migrate away from desktop to tablets and smartphones. At this point, desktop opens are actually the minority compared to mobile devices.

Screen-Shot-2014-05-09-at-6.22.28-AM

Greg Sterling has an analysis of the data from the report, but to me the findings show that a large amount of email marketing is missing the mark by targeting users sitting at a desktop computer browsing through a day’s worth of email. This may have been the norm a few years ago, but today the majority of emails are opened while out and about and emails should be designed to fit this purpose and be able to catch users’ attention from the smaller screen.

You can start making your email marketing strategy more mobile friendly by making your emails explicitly mobile friendly as well as the associated landing pages these emails direct to. In a day-and-age when the majority of people are checking their emails and doing browsing from smartphones there is no excuse to be sending users emails they can’t easily view or sending users to landing pages that require non-iPhone friendly Flash plug-ins.