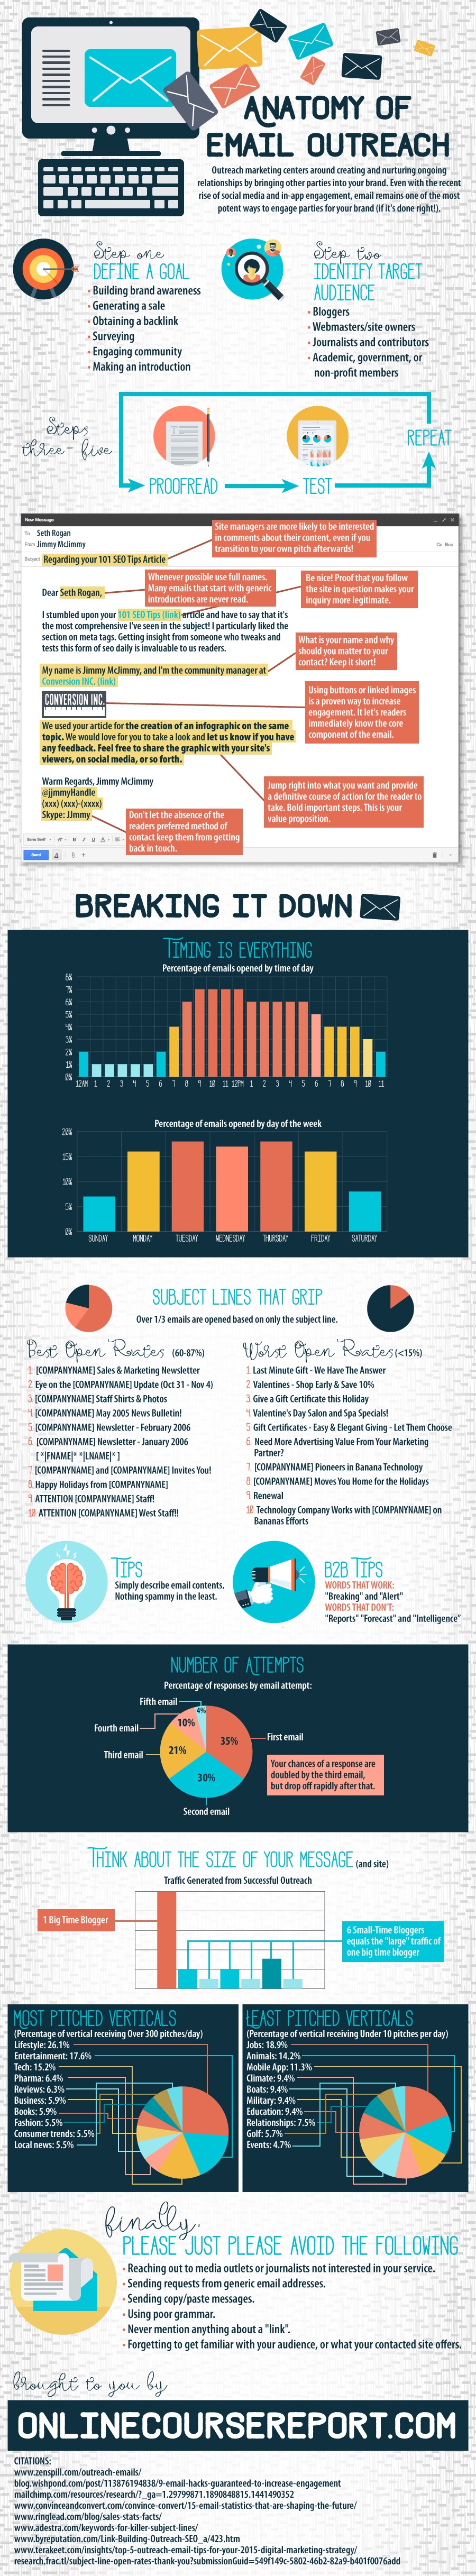
It can be easy to be distracted by the flash and excitement of new marketing mediums and strategies, but there’s a reason some old staples don’t seem to ever go away. Email marketing remains one of the most effective ways to boost sales and connect with your audience. If you want to see true success with your email outreach, you have to break above the noise.
How many unread emails do you have in your inbox right now? According to some estimates, the average businessperson receives 91 emails every single day, and that number is only going up. That means you have to make your emails worthy of your customer’s time and exciting enough to get their attention.
So how do you make sure your emails get opened instead of shipped off to the spam folder or left unread in inbox purgatory? Online Course Report broke down what makes a successful email outreach campaign and put together a handy infographic that details everything you need to know, from what day and time is best to send to how to craft the perfect subject lines.
00Taylor Ballhttps://www.tulsamarketingonline.com/wp-content/uploads/2018/07/TMO-Logo.pngTaylor Ball2016-02-25 10:24:522016-02-25 10:24:52How To Make Your Email Outreach Standout [Infographic]
Google’s Accelerated Mobile Pages (AMP) have been rumored to rollout in late February for some time, and it appears they are finally starting to appear. The AMP listings are being spotted in mobile search results, but it seems they are not available for all searchers.
Accelerated Mobile Pages are pages designed to be super lightweight and allow for incredibly fast load times. It does this by using a unique, streamlined version of HTML that is able to be heavily caches to provide the fastest loading experience possible.
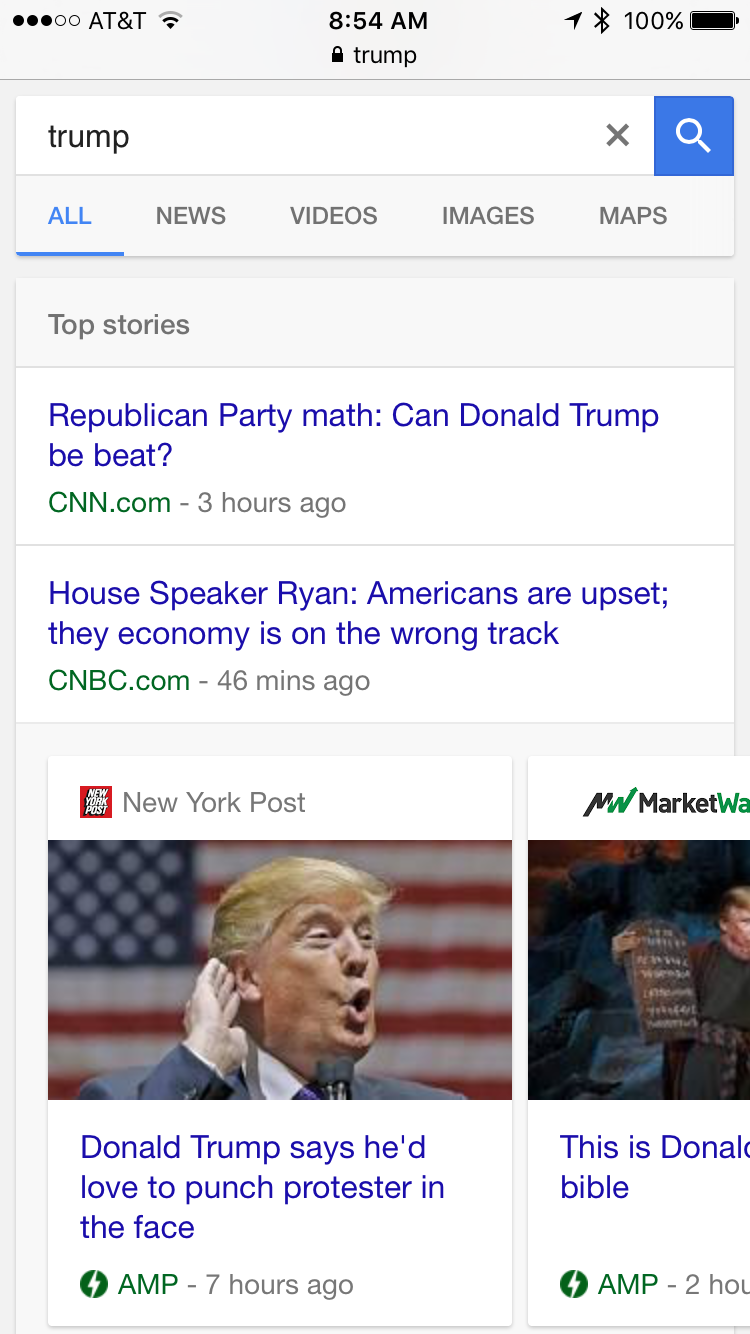
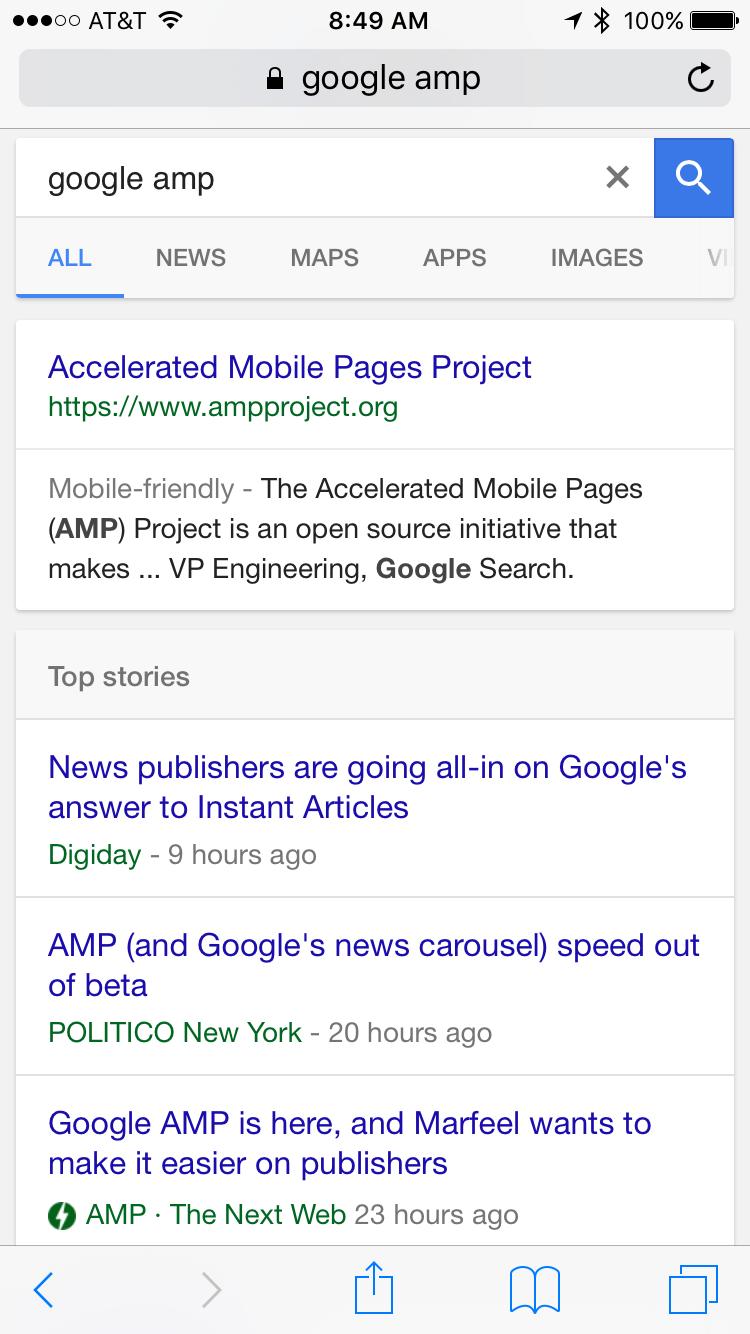
To see if you have access to the new AMP search results, just perform a search on Google.com for any query that would typically trigger a news box. If you can’t think of anything, you can try ‘Trump’, ‘Google’, or ‘Obama’.
Barry Schwartz shared a few screencaps of what you can expect to see as the listings become more widely available. You can see them below:
This screencap shows AMP listings appearing in the news listings, rather than the carousel:
00Taylor Ballhttps://www.tulsamarketingonline.com/wp-content/uploads/2018/07/TMO-Logo.pngTaylor Ball2016-02-24 11:04:342016-02-24 11:04:34Accelerated Mobile Pages Are Rolling Out Across Google
Google has been vocal lately about encouraging webmasters to improve the loading speed of their websites, especially on mobile devices. It has made loading speed one of its many ranking signals and is rolling out Accelerated Mobile Pages (AMP) to improve mobile website speed.
With all this effort to make mobile loading speed an important issue for webmaster, you might think Google would be ahead of the curve when it comes to making sure their pages load quickly on mobile devices. Not so, according to a recent test shared on Hacker News.
The test was conducted using Google’s own PageSpeed Insights tool and several others have replicated the results on their own. The findings seem clear; Google is the slowest loading home page on mobile in its market.
You can see the results of some of the speed tests below:
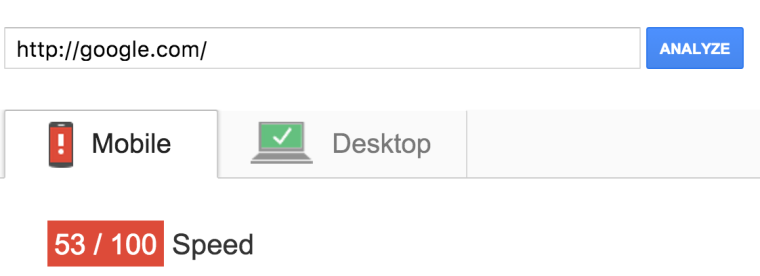
Google’s loading speed
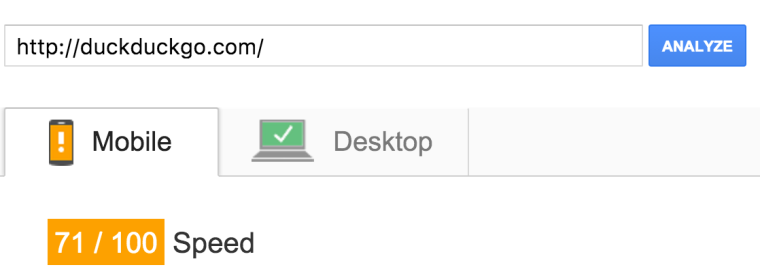
DuckDuckGo’s loading speed
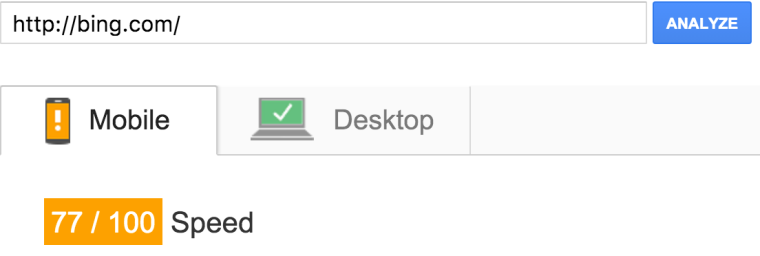
Bing’s loading speed
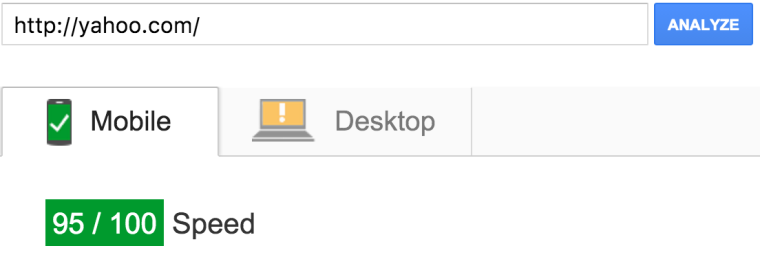
Yahoo’s loading speed
Somewhat surprising, Yahoo came out ahead of the pack with a loading speed significantly faster than anyone else in the market. That may be part of the reason Yahoo has seen faster growth on mobile than Bing or other alternatives to Google. However, Yahoo’s market share of mobile search still sits at just over 3.5% compared to Google’s 94%.
Several elements are slowing down Google’s mobile home page, including render-blocking JavaScript and CSS in above-the-fold content. Once AMP is rolled out, this could change. If Accelerated Mobile Pages are as effective as Google claims, it should have one of the fasted loading home pages on mobile once the new system is released. But, it is interesting that Google is currently lagging behind the field.
00Taylor Ballhttps://www.tulsamarketingonline.com/wp-content/uploads/2018/07/TMO-Logo.pngTaylor Ball2016-02-23 11:19:022016-02-23 11:19:02Google Has The Slowest Loading Mobile Home Page In Its Market
Google has officially confirmed the end of ads in the right hand column of its search pages, except for two notable exceptions.
As of February 19th, Google is phasing out ads on the right side of its desktop search results. Instead, all ads will appear at the top or bottom of the results, though Google may include an additional ad above results for “high commercial queries.”
The change will effect users worldwide, in all languages. Google is also saying the change is motivated by a push to bring desktop results closer to the mobile experience, however rumors suggest the low click-through rate (CTR) of right side ads may also be a factor.
There are also two specific exceptions to the change. No ads will appear on the right side of desktop search results except in two cases:
Product Listing Ad (PLA) boxes will still show either above or to the right of search results
Ads can still appear in the Knowledge Panel
Overall, most users probably won’t notice the difference in search results. However, businesses competing for the already limited organic space on the front page of search results may find the change makes the competition even fiercer.
The decreasing front page real estate means an even higher focus on SEO for businesses seeking high ranking organic listings.
The rollout for the change should be complete today.
00Taylor Ballhttps://www.tulsamarketingonline.com/wp-content/uploads/2018/07/TMO-Logo.pngTaylor Ball2016-02-22 11:42:442016-02-22 11:42:44Say Goodbye: Google Drops Ads In Right Hand Column
Facebook is overhauling its Video Metrics section of Page Insights with several new improvements and features to improve how it allows users to track video engagement. To start with, the company is completely redesigning the entire interface to the Video Metrics section. But, it is also launching a few highly requested metrics to better gauge how users are watching videos on the platform.
Since Facebook has launched the video portion of its platform, it has allowed Page owners to track total view counts on videos. However, it did not provide any information on how long people watched for or if they clicked away at some point in the video.
Now, Facebook will display the total minutes viewed watching a video, so Page Owners can tell if they are losing viewers mid-watch and get a better perspective on the effectiveness of their videos. The company says it was the number one most requested feature.
In addition to this, Page owners are also now able to track views more closely with the new 10-Second Views metric, which shows how many viewers watched for at least 10 seconds. This is big for two reasons. On one hand, Facebook has received criticism for counting any view over three seconds in their video counts, compared to YouTube’s harsher 30 second standard for view counts.
The new 10-Second Views metric is also important because Facebook announced last summer that advertisers will only be charged for ad views if their video was watched for more than 10 seconds.
Alongside these view-length metrics, Facebook also rolled out an interesting new metric that gives Page owners a better idea of exactly how users are watching their videos.
Within the Insights view of individual videos, Page owners can see the amount of people that viewed a video with the sound on vs with the sound off. This lets Page owners get an idea of their audience and how their videos are being interacted with.
For example, if the majority of views are coming from users with the sound off, there is a good chance your audience is primarily watching videos at work, school, or in another public space where sound shouldn’t be turned on. You can take this into account with your future ads by being sure to optimize sub-titles and perhaps take a more visual approach with your content.
These changes allow Page owners and advertisers to gain a much deeper insight into how their ads and videos are performing, and that means allowing them to make even better ads and videos for their audience. If you want to make sure your ads are really successful, you should consider giving these new video metrics a look.
00Taylor Ballhttps://www.tulsamarketingonline.com/wp-content/uploads/2018/07/TMO-Logo.pngTaylor Ball2016-02-19 14:04:182016-02-19 14:04:18Facebook Brings New Look, Important New Stats To Video Metrics
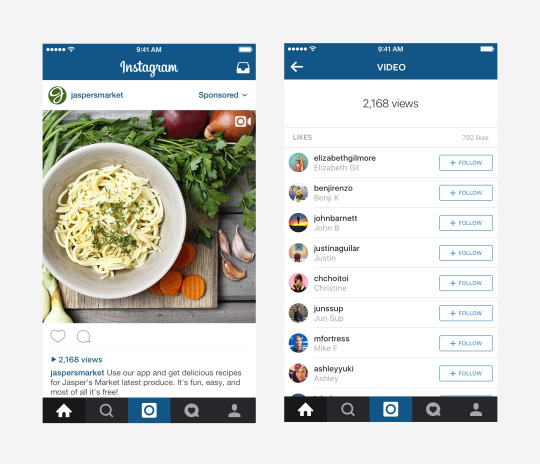
It has been almost three years since Instagram stretched its legs and expanded to video, but in all this time it has been missing a crucial feature – view counts. While the other giants in social video like YouTube, Facebook, and Vine have let users see how many times a video has been played, Instagram has been slow to add any view count feature to their platform. Until now.
Instagram has announced it will soon be adding a counter that includes everyone who has watched at least three seconds of a video.
The company says the feature will be rolling out over the “coming weeks” and will show alongside the existing like and comment counts.
The feature could be beneficial for advertisers on two fronts. On one hand, it will be greatly useful to simply be able to see what their most popular content is in a more direct way than with like and comment counts. While those show engagement levels, a view count will be a much better indicator if video reach.
Secondly, as Twitter has recently seen, when users see that others are watching and interacting with content, they are more likely to view, engage, and share that content. By letting other users see that your videos are popular with other users, you also see a chance at increasing your total view counts overall.
00Taylor Ballhttps://www.tulsamarketingonline.com/wp-content/uploads/2018/07/TMO-Logo.pngTaylor Ball2016-02-15 14:04:032016-02-15 14:04:03Instagram Rolls Out View Counts For Video
Adobe Flash is all but dead and Google is putting the final nails in the coffin by dropping support for Flash-based ads in favor of ads coded in HTML5. This isn’t happening immediately, but Google announced its intention to move to HTML5 by January 2017 in order to give advertisers time to transition.
As part of this transition away from these ads, Google will no longer allow Flash formatted ads to be uploaded to the Google Display Network starting June 30th of this year. Up until then, you can still upload any Flash-based display ads you’ve been working on and they will continue to run until January.
Google notes that you should update your display ads before either of these dates for best performance, and that video ads built in Flash will not be impacted by the change.
The death of Flash is likely to be dragged out for quite some time, but this is a big loss for Adobe’s format. Adobe’s player only accounts for 5% of mobile and web video seen last year, but it has still been a major part of major online ad networks. If these ad networks no longer accept Flash, then Flash loses its one last thing keeping it relevant.
00Taylor Ballhttps://www.tulsamarketingonline.com/wp-content/uploads/2018/07/TMO-Logo.pngTaylor Ball2016-02-12 11:13:482016-02-12 11:13:48Google To Drop Flash From Google Display Network Ads
Twitter is calling its latest new feature an improvement to their timeline, but many users disagree. The new Improved is an algorithm-based feature which uses data collected from a user’s previous activity on Twitter to show them the tweets that are of most interest to them at the top of their timeline.
The goal, according to Twitter, is to make sure users see all the most “important” tweets for them as soon as they log in. Directly below this section of most important tweets, users will find the traditional reverse-chronological timeline they’ve come to know and love.
While Twitter is hailing the new feature as a move forward, the social media site has been in open rebellion since rumors of the feature started swirling over the weekend. The site saw #RIPTwitter trending as many said the site was losing what made it special in order to be more like Facebook.
The furor over the changes has quieted down somewhat as the company shared more details about the new feature, including its opt-in nature and somewhat non-intrusive design.
This isn’t the first controversial rumored feature from Twitter in recent weeks. The platform faced similar freak-outs when word got out that it was testing significantly longer tweets than the traditional 140-character limit.
That feature has yet to be put into effect, but Twitter is trying hard to walk a very thin tight-rope. The purpose of these new features is to attract new users to the stagnating service. However, losing Twitter’s existing audience in the process may set the company back even further.
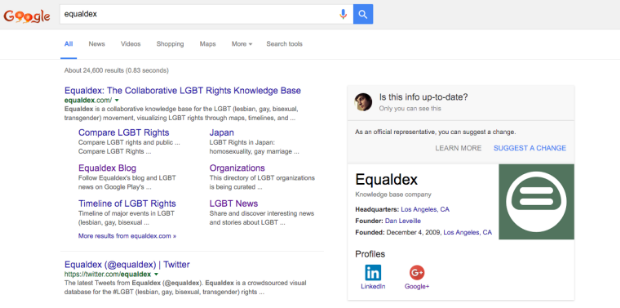
Have your checked your business’s Knowledge Graph information lately? If you haven’t, you may be hearing from Google the next time you perform a search.
Recently, Dan Leveillediscovered that Google is proactively reaching out to searchers and urging them to keep their business listing up-to-date. If you haven’t checked on your listings recently, you may see a similar alert to the one below next time you sign in with a Google account associated with a Google My Business page.
Leveille notes:
“Other than asking developers to include social profile data, this seems like the first time Google is proactively asking business owners to directly suggest edits to their Knowledge Graph info.”
Leveille also uncovered a newly updated help document from Google detailing the criteria for being considered an “official representative of an entity in the Knowledge Graph.”
This is a significant move by Google to try to clean up out-of-date Knowledge Graph information and provide accurate listings. Both local businesses and major corporations can take advantage of the Knowledge Graph, so it is always a good idea to regularly check your listings and make sure they are current.
00Taylor Ballhttps://www.tulsamarketingonline.com/wp-content/uploads/2018/07/TMO-Logo.pngTaylor Ball2016-02-10 10:44:362016-02-10 10:44:36Google Is Urging Business Owners To Update Their Knowledge Graph Listings
Online searchers are increasingly turning to mobile devices during the biggest trending moments, and this year’s super bowl makes that clearer than ever. According to Google, 82 percent of all TV ad-driven searches during the Super Bowl came from smartphones, a 12-point increase from last year.
Desktop continues to trail mobile searches with just 11 percent of Super Bowl searches during the game, while tablets accounted for only 7 percent.
In total, Google says the big ads during this year’s Super Bowl drove over 7.5 million incremental searches. That is a 40 percent increase compared to last year’s game.
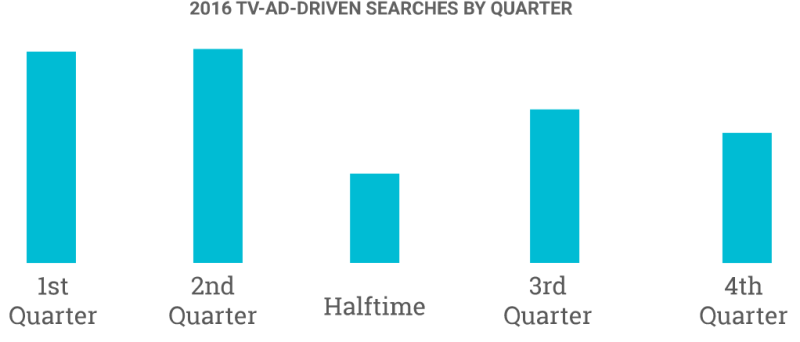
Perhaps due to the close game, the majority of searches driven by Super Bowl TV ads came during the first two quarters of this year’s match. Ad’s related searches dipped significantly at half-time and continued to stay relatively low through the end of the 4th quarter. This is similar to what happened during last year’s close match-up.
This pattern is quite a bit different from 2014, when the Broncos were dominated by the Seahawks. As the score widened in the second half searches increased, suggesting viewers were getting bored with the actual game and paying more attention to ads.
Google’s infographic from the big game shares many other details, like what big brands came out on top and which team won the most searches. The biggest takeaway is that brands who want to capitalize on emerging events and trending moments should prioritize mobile like their audience is.
00Taylor Ballhttps://www.tulsamarketingonline.com/wp-content/uploads/2018/07/TMO-Logo.pngTaylor Ball2016-02-09 11:11:072016-02-09 11:11:07Mobile Wins Super Bowl 50 When It Comes To Search