Tag Archive for: consumer behavior

The holidays are approaching and Microsoft Advertising wants to help your brand prepare before the shopping season arrives.

Microsoft Advertising has released a new free guide called “Your Festive Season Marketing Playbook” which includes all the information you could need to prepare the most efficient and impactful ad strategies for the latest holiday trends and shopping behaviors. 

Below, we will share some highlights to help steer your ad strategies in the coming months.

Start Planning Early

The guide encourages brands to start planning their campaigns and budgets early, to avoid falling behind. Data from past years suggests that shopping for the holiday season may start as early as September, with a notable increase in both traffic and purchases between September and October throughout much of the world. 

October Clicks Matter In November and December

Another sign that holiday shopping begins earlier than expected is the discovery that approximately two-thirds of purchases in November and half of December purchases can be traced back to clicks in October. 

Now is when brands are able to plant the seeds in shoppers’ heads that turn into holiday purchases. Using remarketing, in-market audiences, and automated bidding strategies, you can develop these initial clicks into later sales.

Deal Seeking is Up

According to the guide, American consumers are spending much more time hunting for deals than in the past. Around two-thirds of shoppers are now devoting significantly increased time to looking for coupons, promotions, or other types of deals. Compared to other regions, shoppers in this area spend approximately 33% more time using search to find deals compared to the average shopper around the world. 

Desktop Drives Holiday Sales

According to the data collected from the Microsoft Advertising Network, just 28% of holiday ad clicks are made by mobile devices, which only account for 22% of total retail conversions around the holiday shopping season. 

This suggests that desktop devices are contributing to the bulk of holiday shopping activity despite the major rise in mobile shopping over the past few years. 

For more about these shopping trends, ad strategies, and holiday marketing recommendations, download the Festive Season Marketing Playbook for yourself here.

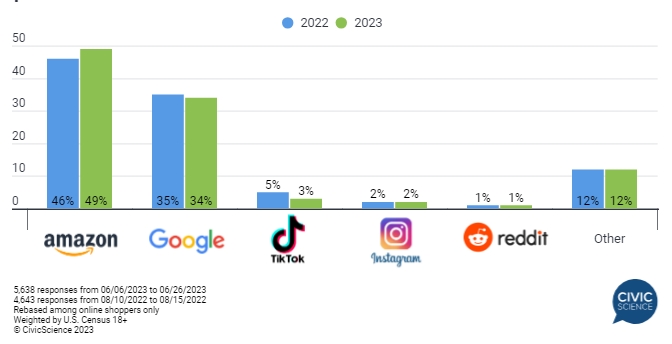
Fewer people are using TikTok compared to last year and the social network is losing ground as an e-commerce search engine, according to a new study from CivicScience. 

Meanwhile, Amazon is reconnecting with younger generations and growing as the main starting point for people looking for products online. 

In the study, CivicScience asked U.S. online consumers this question: “When shopping for a product online, where do you typically start for product searches and research?” The survey then compared the responses from this year’s survey against those from 2022. 

TikTok gained some attention last year when analysts noted that it was driving a surprising amount of e-commerce-related search traffic – particularly from younger users. This led the company to announce it intends to develop a $20 billion e-commerce business. It is unclear if recent trends have changed those plans or not. 

It is no surprise that Amazon and Google continue to dominate the e-commerce search market. No other challengers have come close. However, Google did see a slight dip in the number of e-commerce searches being made on its platform. 

The most notable shift from this year’s findings may be the increasing popularity of Amazon among younger age groups who had been previously moving away from the shopping platform. 

Compared to last year, Amazon increased its popularity among younger age groups including 18- to 24-year olds (up 45%) and 25- to 34-year-olds (up 44%). 

For more, read the findings from CivicScience here.

Despite the increasing pressure many shoppers are feeling from inflation, the latest data from this year’s Black Friday shopping shows that consumers are still taking the shopping event seriously.

Brick-and-mortar store visits grew by an estimated 2.9% compared to 2021, according to a report from Sensormatic Solutions. Meanwhile, Adobe Analytics found that online sales rose by 2.3% to $9.12 billion.

This increase in in-person shopping likely reflects the easing of Covid-19 restrictions across the country and the increasing comfort shoppers are showing about going to brick-and-mortar locations. Stats from Thanksgiving Day itself back this up, with a whopping 19.7% increase compared to 2021. 

Bloomberg had similar findings, with data showing that increased mall traffic rise by approximately 1.2%, and traffic to other types of shopping locations (such as strip centers or standalone stores) climbed 4.7% compared to the past year. 

Notable Stats from Shopify

Shopify also released its data from this year’s Black Friday Shopping, accounting for a record-setting $3.6 billion across the platform from the start of Black Friday in New Zealand to the end of Black Friday in California. 

At the height of the day’s sales, Shopify saw $3.5 million per minute.

The report also included some other interesting highlights:

  • Top selling countries and cities where shoppers made purchases from: United States, United Kingdom and Canada, with the top-selling cities on Black Friday including London, New York, and Los Angeles
  • Top product categories: Apparel & accessories, followed by health & beauty, and home & garden, with trending products including Snocks GmbH (Boxershorts), rhode (peptide glazing fluid), and Brooklinen (Luxe Core Sheet Set)**
  • Average cart price: $102.31 USD or $105.10 USD on a constant currency basis  
  • 15%: Cross-border orders worldwide on Black Friday as a percentage of total orders 
  • 27%: Growth in POS sales made by Shopify merchants globally over last year’s Black Friday

What We Can Learn From This

Despite challenges, Black Friday and the surrounding weekend remain major events for consumers and retailers. With the end of Covid restrictions, consumers use a renewed sense of flexibility to find the best deals online and in-store.

For retailers, it is more important than ever to ensure your customers can easily find you and compare your prices and products. The online shopping space is increasingly crowded and it is up to you to stand out with great offers, well-crafted sales messages, top-level service, and high-quality products.

Advertising has undergone a massive shift in recent years. Instead of the sleek, high-end style that many associates with ads, consumers (and a growing number of brands) are embracing a more lo-fi, “imperfect” approach to ads. According to new research from Meta, this is especially true when it comes to social media ads.

In a recent blog post, Meta suggests this is about more than a change in visual trends. It is a shift in cultural standards and expectations, or “culture codes.”

As the post explains, this is “being driven by something more fundamental, which is a shift we’re seeing away from perfection and polish, towards a culture that instead celebrates what’s unpolished and real.”

Though it is unclear just how long this shift has been happening, Meta first noticed it in a study of Instagram Stories ads conducted back in 2019. 

The results of this study showed that ads that used a less-polished style performed far better in tests for both ad recall and content views compared to those with a more refined appearance.

This is particularly true for younger audiences who tend to spend a lot of time on social media. In a recent study from consumer behavior analysts YPulse, up to 84% of young consumers reported “I like it when content from brands is not perfect” and  79% said they are “tired of seeing perfect images in advertising.”

With this in mind, the researchers at Meta dug deeper to identify 6 specific codes that brands should follow if they want to continue connecting with online audiences:

Include Real People Telling Real Stories

Including real people – especially your actual employees or customers – helps to give your message authenticity. This is crucial for getting through to today’s savvy audiences.

Use “The Language of the Platform”

Obviously, we aren’t referring to the actual language you or other users speak, such as English, Spanish, Afrikaans, etc. In this case, speaking the language of the platform is all about proving you are “one of us” to other users by taking part in the latest trends, such as participating in “challenges”, putting a new spin on a popular dance, or using the hottest filters.

This helps establish your brand’s relatability to your audience.

Establish Relationships with Creators and Influencers

No matter what your feelings are about social media influencers, there is no denying the impact they can have on social media audiences.

According to Meta, even adults aren’t immune to the reach of influencers, with 63% of adults between 18-34 saying they trust a popular creator’s view of a brand.

This is considerably more than those who reported trusting brands themselves.

The power of influencers really comes down to the fact that they have established a relationship with their viewers and have an incomparable reach. This helps build your own credibility with a whole new audience you might have never reached before.

Go Behind The Scenes

When users say they don’t want to see “perfection” in ads, they don’t necessarily mean they want low-quality or poorly made ads. They just want to know your message is based in reality. This is why viewers tend to respond strongly to brands who are willing to take them behind the curtain. 

Keep Your Video Lo-Fi

Today, it is easier than ever to get access to affordable editing and production tools that can make your ad look like a Hollywood movie. Don’t use them. Sticking with simpler, lo-fi editing and production techniques, such as the most popular editing apps for smartphones, keeps your ad feeling authentic and hand-crafted.

Use Humor to Connect With Audiences

Humor is consistently one of the most effective tools for getting audiences to lower their guard. It makes your brand more relatable and makes listeners want to hear what else you have to say. The obvious catch here is that brands must be careful because several brands have made tone-deaf jokes which missed the mark and hurt their reputation.

It is no secret that the past few years have wildly shaken up the world – especially when it comes to doing business. Coronavirus, international shipping delays, and rising prices have drastically reshaped customer needs and expectations in virtually every market – as a new report from Google makes particularly clear.

Using a comparison of search trends from 2021 to 2022, Google’s data reveals what customers are looking for as we settle into a “new normal” and brace for even more new challenges in the future.

What Customers Want

More than anything, the search trends from Google reveal that customers are looking for brands that can provide the goods and services they are looking for when they need them. This is reflected by significant increases in searches extended hours and quick service. 

For example, the report shows these search phrases saw major increases over the past year:

  • “Late night shopping”: Up 100% year-over-year
  • “24/7 customer service”: Up 500% year-over-year
  • “Next day flower delivery”: Up 800% year-over-year

Return to In-Person Events

Google search data makes it very clear that consumers are itching to get back out and enjoy in-person events again, now that the coronavirus pandemic appears to be winding down. This has led to growth in searches for phrases like:

  • “Cinema near me”: Up 300% year-over-year
  • “Seating chart”: Up 600% year-over-year
  • “Spring break”: Up 100% year-over-year
  • “Unique things to do in”: Up 100% year-over-year

Some Pandemic Trends Linger

While shoppers are eager to ditch some aspects of the pandemic, Google pinpoints a few trends which popped up during quarantines and appear to be sticking around. These “sticky” trends include:

  • “Makeup game”: Up 700% year-over-year
  • “Best movies to stream right now”: Up 300% year-over-year
  • “Nursery plants near me”: Up 100% year-over-year
  • “Hair trends female”: Up 800% year-over-year

For more, check out Google’s full Global Insights Briefing for 2022 here.

The coronavirus pandemic brought unprecedented changes to practically every market around the world. While existing businesses struggled with new safety requirements, the number of new business openings slowed significantly.

As we come to the end of the second year of living with the COVID pandemic, though, it appears new business openings are close to reaching pre-pandemic levels, according to Yelp’s COVID-19 Second Anniversary Report

Specifically, new business openings in the second year of the pandemic were just 1% below rates from the year before the pandemic (2019). Over the year, at least 521,926 new businesses were established – up 14% from the first year of the pandemic. 

How New Variants Affected New Business Openings

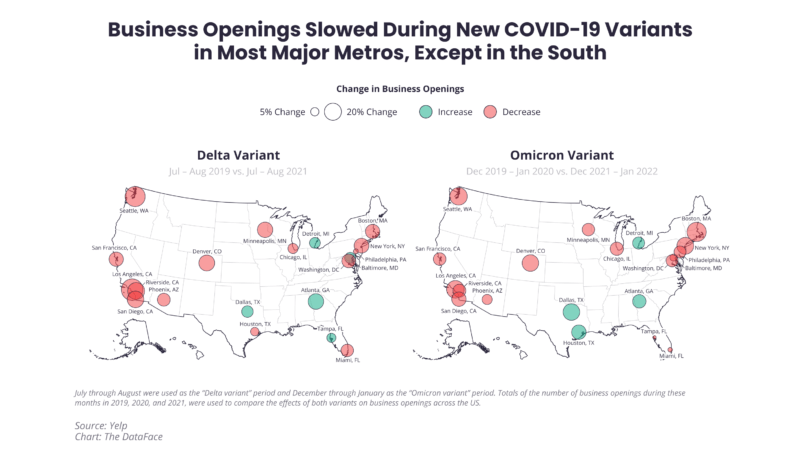
While new business openings are on the rise overall, this is not happening without setbacks. The Delta and Omicron variants caused dips in openings, especially in the largest cities across the US. In many cities, these hurdles slowed growth enough to cause an overall decrease in openings.

Despite this, other cities like Atlanta, Dallas, and Detroit helped offset these losses. 

New Expectations For Businesses

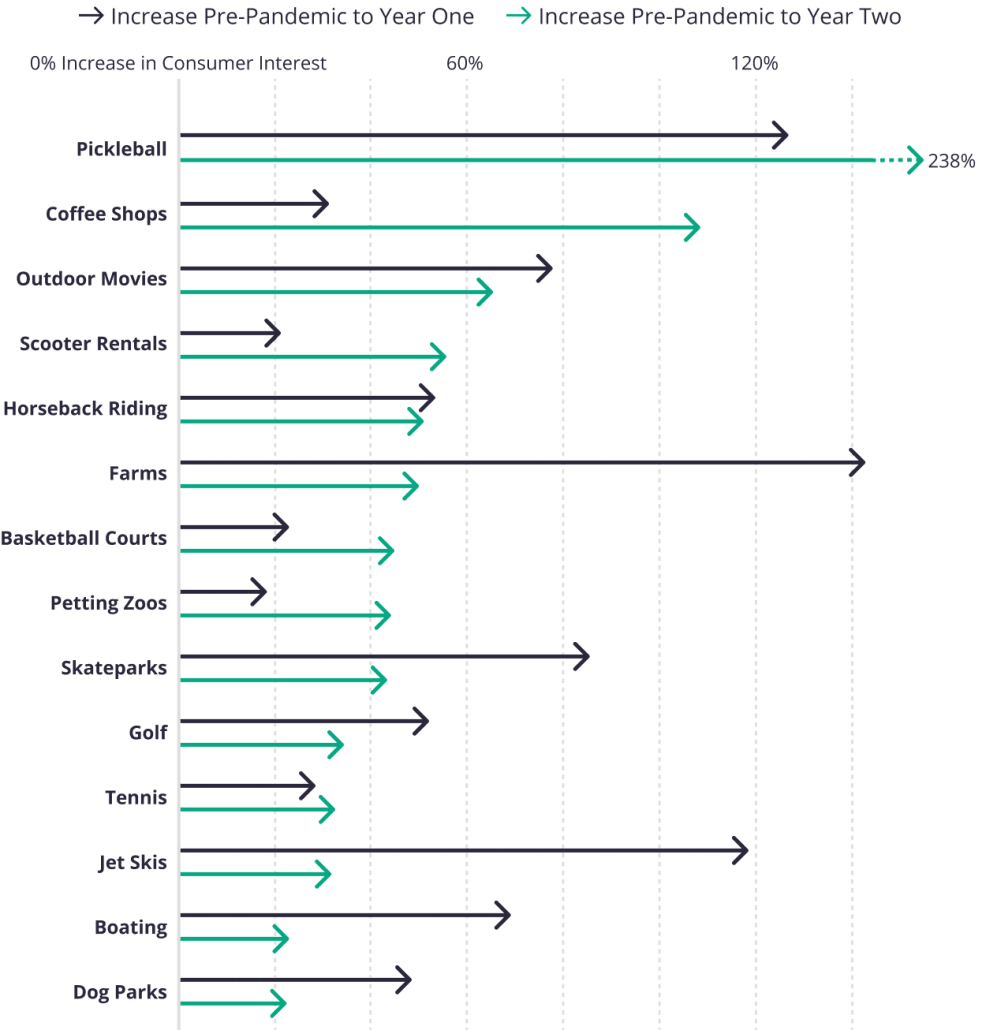
While openings are returning to pre-pandemic rates, Yelp emphasized that the coronavirus pandemic is still strongly influencing consumer behavior. For example, interest in outdoor seating continued to rise by 292% in the second year of the pandemic. 

Similarly, consumer interest continues to be heightened for outdoor activities, including scooter rentals, outdoor movies, and the newly trendy pickleball.

The Big Picture

Businesses continue to stand strong in the face of the COVID pandemic, despite new challenges like labor shortages and supply bottlenecks. Being adaptable has long been a key trait of successful businesses, especially after the onset of the COVID pandemic.

A new study conducted by Google and Boston Consulting Group indicates that 90% of consumers are willing to give brands their email addresses, so long as there is an incentive. 

The results come from an exploration into how consumers view modern advertising, including targeted ads, sharing personal information with advertisers, and email marketing.

As online advertising has become more pervasive and personalized to consumers, it is widely believed that shoppers have become jaded and worn down by online ads. As such, many believe shoppers are generally unwilling to engage with online advertisers. However, this study refutes this idea quite clearly.

Instead, the findings show that modern consumers are quite willing to engage with ads on the condition that they are relevant to their needs and interests.

How Consumers View Targeted Ads

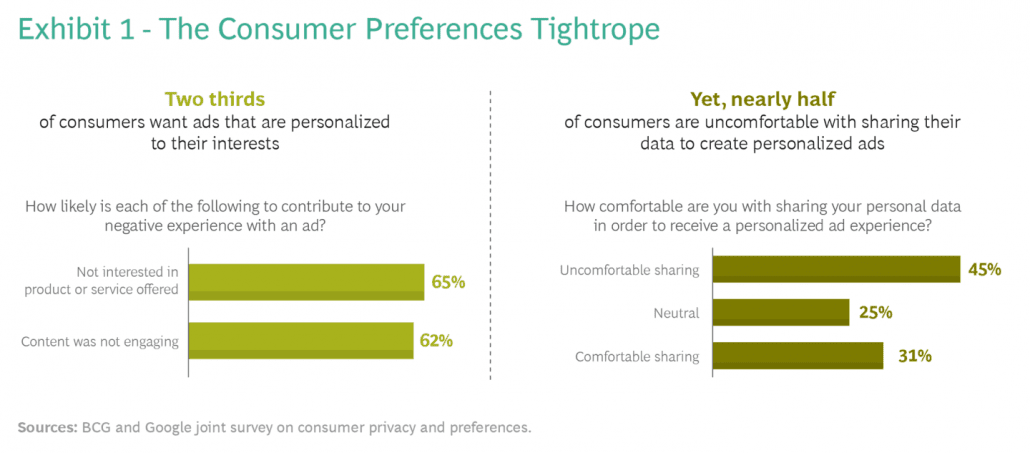
First and foremost, the new research makes it clear that advertisers do not dislike all advertising. They dislike irrelevant advertising, with 65% of people saying they have negative experiences with ads that are not relevant. Additionally, 74% of consumers say they only want ads that are relevant. 

These consumers are also largely aware that receiving ads that are targeted to their interests requires some amount of data sharing.

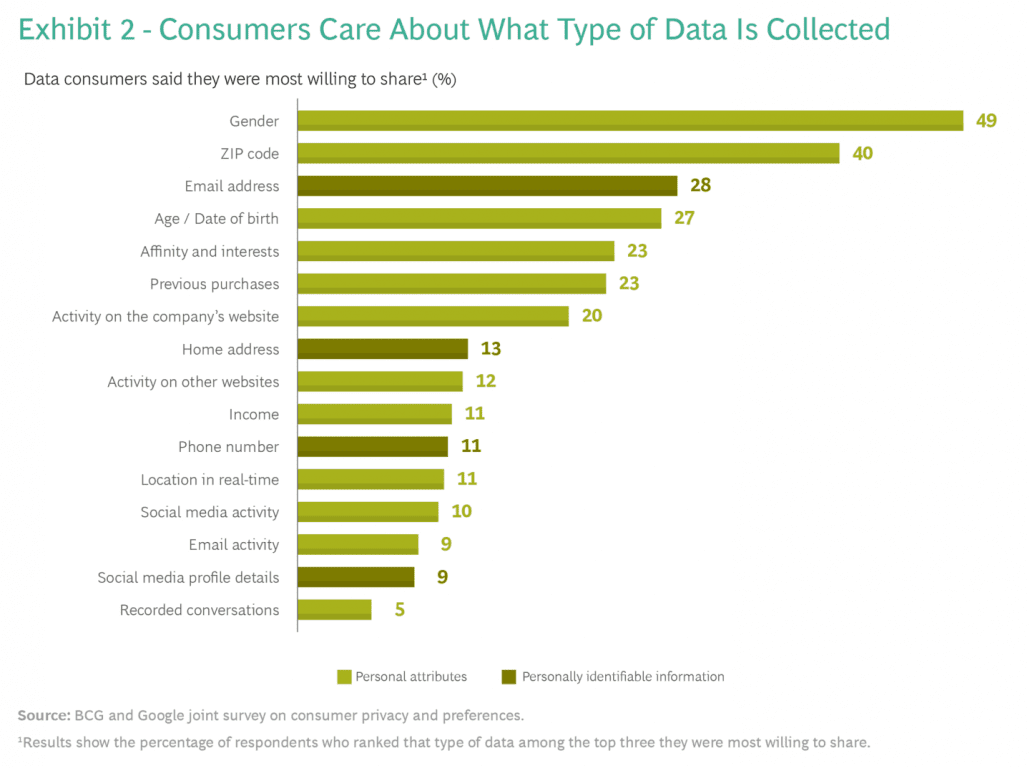
According to Google’s research, most consumers are willing to share some personal information, so long as it is not overly invasive. 

At the same time, some demographics are more willing to share specific details such as their gender, age, or online activity compared to other groups.

For example, Young Urban Professionals tend to be more willing to share their social media activity, but less willing to tell advertisers their gender. 

When consumers’ concerns are addressed, users may be even more willing to share personal details. These concerns include what specific information is being collected, how an advertiser is collecting this information, and what they intend to use it for. 

How Incentives Increase Data Sharing

Another major concern advertisers need to address is “what’s in it for me?”

While nearly 1 in 3 consumers say they are willing to give out some personal information such as their email address for absolutely nothing, more than 90% say they are willing to give their email address if given the right incentive – such as a discount or free sample. 

Not only does an incentive simply give a person a reason to sign up, but it also gives a brand an opportunity to prove themselves to shoppers and earn their trust. 

This is crucial for brands because at least 29% of new customers say they start from a place of mistrust with all companies from any industry. Why? Because they are concerned that brands will then sell their private information to less scrupulous marketers.

As Google’s report explains:

“And while almost 60% of customers believe that companies are selling their data, our research found that very few brands do that.

Marketers understand the value of data and the trust their customers place in them — and how customer-centric, data-driven marketing unlocks significant gains across business objectives.”

Key Takeaways

Google’s report concludes with three major recommendations based on the study’s findings:

  • Build trust by prioritizing transparency
  • Create great experiences through first-part data
  • Build a data-centric organization that respects privacy at all levels

For more in-depth information, read the full report from Google here or from Boston Consulting Group here.

With Halloween getting closer, everyone – including Google – is getting into the holiday spirit.

As the company does every year, Google is sharing the biggest search trends related to Halloween 2021, including the most popular scary movies, haunted houses, trending costumes, pumpkin patches, and more.

While some topics like the most popular movies stay largely the same year to year, other areas like popular costumes may provide a little more insight into the current trends and interests right now.

Getting out and enjoying seasonal in-person events like corn mazes and pumpkin patches also seems to be of particular interest this year, after the more subdued (if not completely canceled) Halloween during the peak of 2020’s Covid pandemic.

Let’s recap some of the top trends for Halloween 2021:

Top Halloween Movies

Unsurprisingly, the list of top Halloween movies includes a mix of horror classics and seasonal family staples which have lasted for decades since their original release.

  • Halloween (1978)
  • Friday the 13th
  • Hocus Pocus
  • A Nightmare on Elm Street
  • Halloweentown

Top Halloween Costumes

Based on early indications, the latest movies are mixing with a Halloween classic and a beloved celebrity to fill out the most popular costumes this year. Meanwhile, the couples costumes are a mix of famous couples from both screen and history, including a fair number of cartoon characters.

Trending Individual Halloween Costumes:

  • Squid Game
  • Gorilla
  • Britney Spears
  • Carnage
  • Venom

Trending couples costumes:

  • Trixie and Timmy Turner
  • Bonnie and Clyde
  • Skid and Pump
  • Mr. and Mrs. Smith
  • Cosmo and Wanda

Trending dog costumes:

  • Squid Game
  • Race car
  • Vampire
  • Donkey
  • Lobster

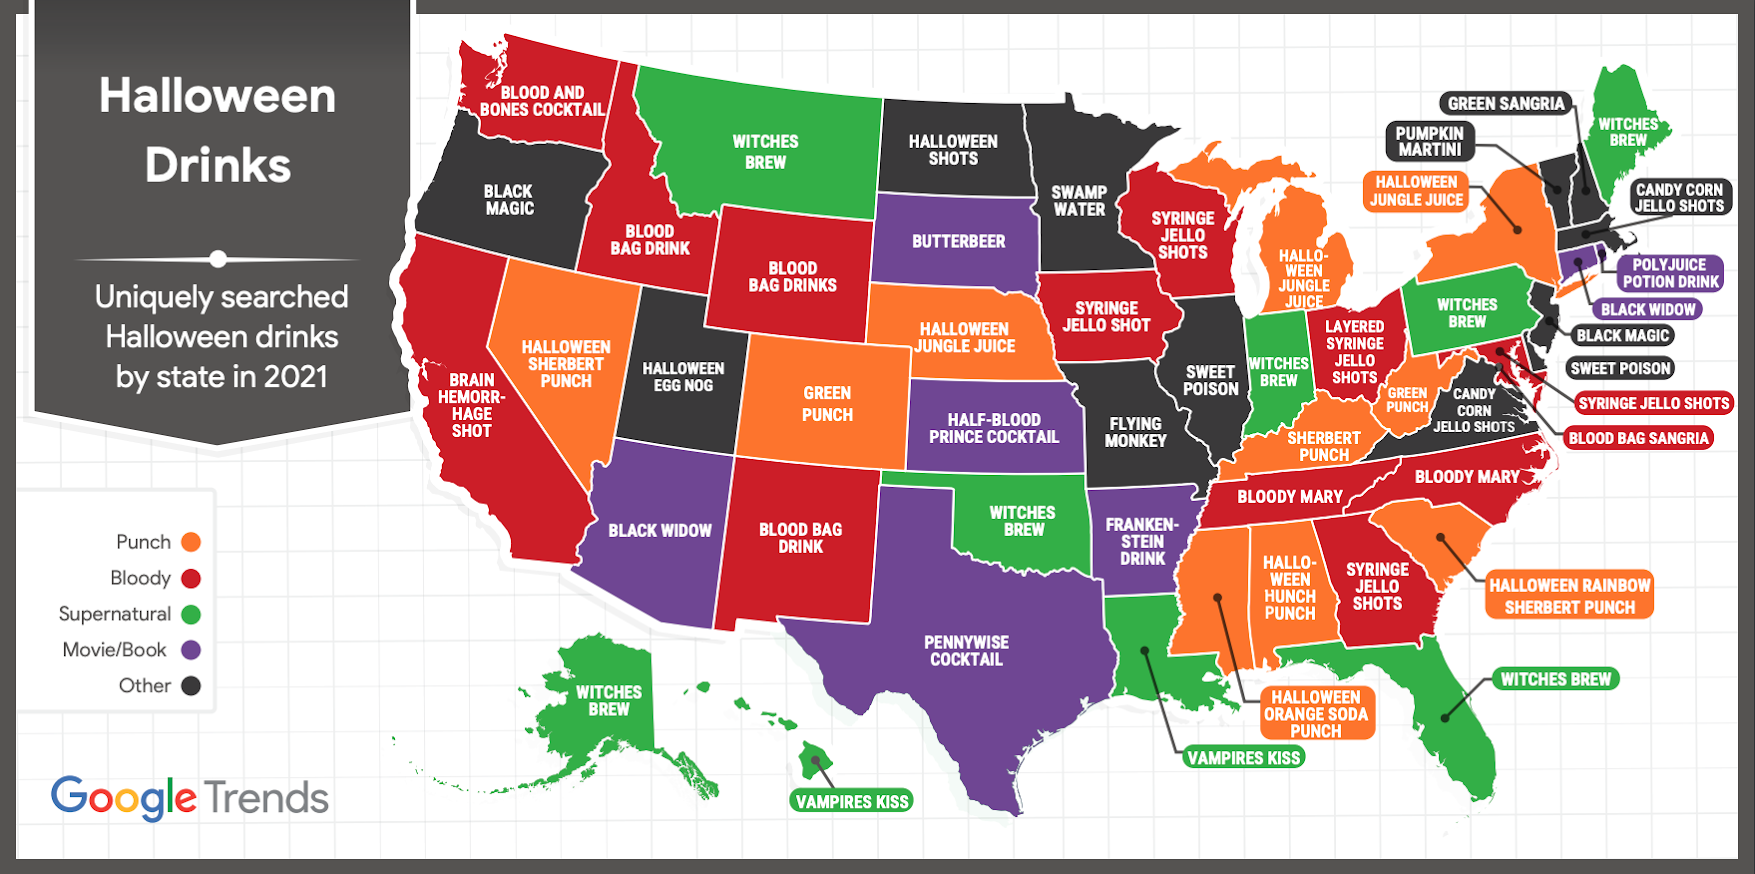
Top Halloween Drinks and Candy By State

Lastly, Google highlighted the top festive treats for both trick-or-treaters and adults. Specifically, the list collected the top Halloween-related drinks by state:

For more, check out the full Google Halloween Trends and Google Maps Halloween Guides.

With vaccination rates on the rise and everyone on the country itching to return to something close to “normal”, Pinterest says many are turning to the internet to help plan their upcoming adventures, vacations, and more. 

In particular, the social network says Pinterest searches by Gen Z users have shot up more than 95% year-over-year, with much of this being attributed to a rise in searches for life after Covid.

The data from the company’s Q1 search trends report reveals a lot about how people see their lives as we get back out in the world and try to make up for the lost time. Find out more below:

Vacation Searches (Up 75%)

It’s not unusual for many to start planning their spring break trips and summer vacations once Christmas is in the past. What is unusual is to the rates for these searches to shoot up three times faster than average from January 2021 to March 2021. 

Even more, the searches show that users intend to make these trips something special. 

Pinterest says it saw significant leaps in all of these search terms:

  • Searches for “dream vacation destinations”: Up 13x
  • Searches for “luxury vacation”: Up 6x
  • Searches for “vacation fashion”: Up 3x
  • Searches for “travel tattoos”: Up 45%

Eye-Popping Fashion (Up 85%)

Overall, people are tired of wearing sweats, tank tops, and hoodies every day as they work from home. Users have shown a distinct desire to dress their best as we start to get out of the house more, with searches containing the word “outfit” at an all-time high. 

Compared to Q1 of 2020, the site has seen a 26% increase in searches containing the word “outfit”. Even more, searches with that word shot up 85% in April compared to last year. 

Notably, Gen Z seems ready to really do it up, with search terms for bold patterns, retro styles, dramatic accessories, and daring makeup all showing increased attention this year:

  • Searches for “outfit”: Up 26%
  • Searches for “Y2K outfit ideas”: Up 230%
  • Searches for “60s and 70s fashion”: Up 133x
  • Searches for “zebra pants”: Up 14x
  • Searches for “plaid pleated skirt”: Up 12x
  • Searches for “clay rings”: Up 303x
  • Searches for “hippie jewelry”: Up 16x
  • Searches for “nose chain piercing”: Up 8x
  • Searches for “makeup makeover”: Up 100x
  • Searches for “alt makeup”: Up 60x
  • Searches for “puppy eyeliner”: Up 30x

Socializing and Parties (Up 64%)

Of course, you need somewhere to wear all those stylish trends, right? 

It should shock absolutely no one to see that users – especially those among Gen Z – are looking to party as larger gatherings become allowed. 

From November 2020 to March 2021, searches containing the keyword “party” have risen 64%. Year-over-year, the number of searches has doubled

Interestingly, the interest in parties range from extravagant affairs  to tasteful small gatherings with search rates for all these terms showing heightened interest recently:

  • Searches for “party life”: Up 3x
  • Searches for “Euphoria party ideas”: Up 43x
  • Searches for “backyard dinner party”: Up 3x
  • Searches for “party food buffet”: Up 10x
  • Searches for “dinner date outfits”: Up 30x
  • Searches for “hotel room party”: Up 8x
  • Searches for “group tattoo ideas”: Up 13x

Home Renovations (Up 28%)

While we may all be a little tired of spending too much time at home, home renovation interest appears to be at an all-time high on Pinterest. 

Similar to vacation searches at this time of the year, the platform says it typically sees spikes in home repair and renovation searches during this season. What the platform has seen this year, though, still far outpaces what they’ve observed in the past. 

Compared to Q1 2020, searches for home renovations were 28% higher on Pinterest, and 65% higher than Q1 2019. 

Specifically, the company says it saw spikes in searches for these search terms:

  • Searches for “home renovation ideas”: Up 5x
  • Searches for “grand millennial decor”: Up 3x
  • Searches for “indie room”: Up 132x
  • Searches for “sage green aesthetic”: Up 32x
  • Searches for “eclectic home”: Up 9x

For more, be sure to check out the full report from Pinterest here.

After a prolonged period of testing, Google Ads has officially launched the new Insights page to all advertisers. 

As the company announced, starting April 14th, 2021, “the Insights page is available to all advertisers globally.”

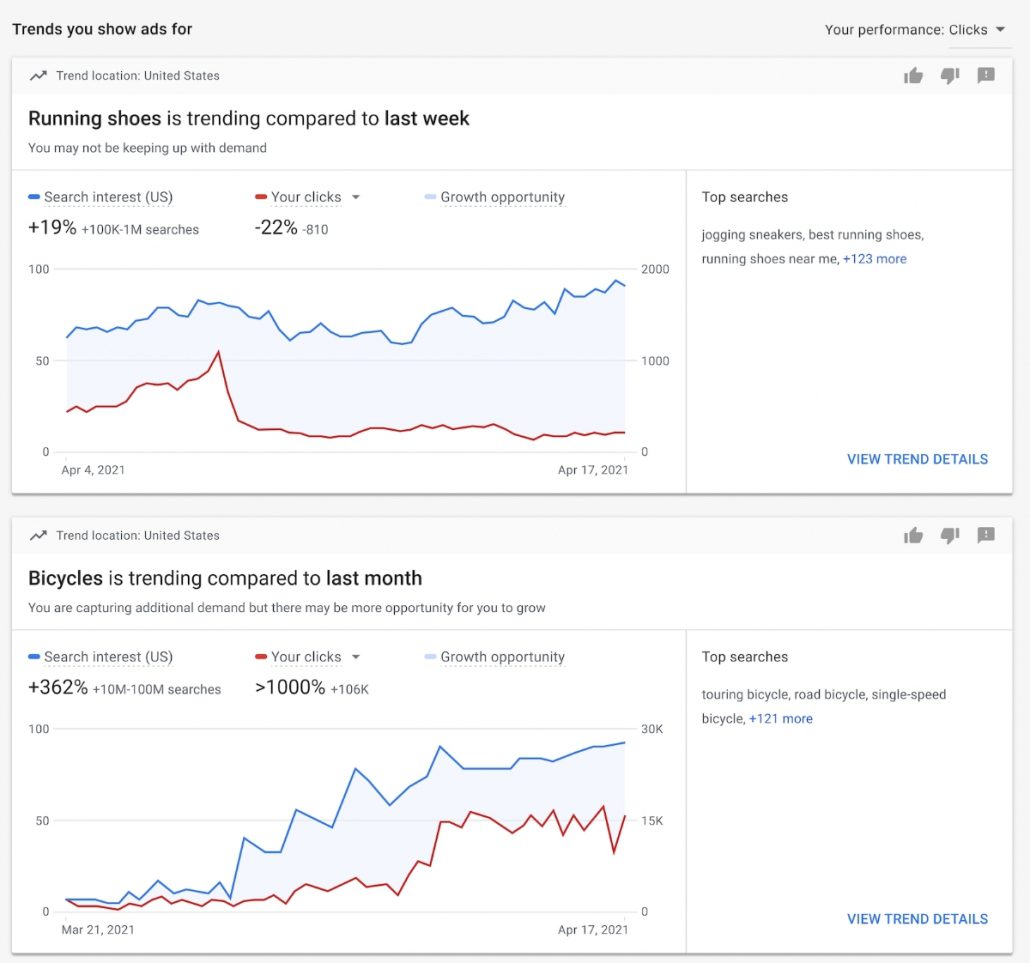
The Insights tool allows for advertisers to easily track and explore emerging trends in your industry to create more effective ads. 

The latest announcement gives an example of how a brand could use the tool:

“Let’s say you’re a pet store looking to reach more customers. With the Insights page, you can see rising demand for ‘dog subscription boxes’ and ‘dog toys’. You can then act on these trends by creating campaigns to reach new pet owners, or even explore selling dog care packages.”

“The Insights page surfaces trends tailored to your business, so you can see if you’re keeping up with demand for trending products or services,” continued the statement.

How Google Ads Insights Works

The new tool pulls data from your account’s performance history and campaign settings, before combining them with search trends across Google to automatically show you relevant trends and insights. 

Currently, the Insights tool only provides one type of data, showing search trends to help you better understand the most recent patterns in search behavior and identify relevant trends in your market. 

However, Google Ads says it will be rolling out more types of insights in the future. 

For more information about the new page, Google Ads has published a help document to get you started tracking the latest trends in your industry.