Tag Archive for: consumer behavior

Getting your customers to share user-generated content like pictures with your products may be an unexpectedly powerful tool in swaying over other shoppers.

A new report from eMarketer claims that 62% of consumers are strongly influenced by user-generated content, including being more likely to buy after seeing pictures of a product shared by other shoppers. 

The survey included consumers from around the globe, including in the US, Canada, France, Germany, and the UK.

Why Shoppers Like Customer Photos and Videos

When asked why shoppers responded so strongly to user-generated content like customer photos, the surveyed consumers said:

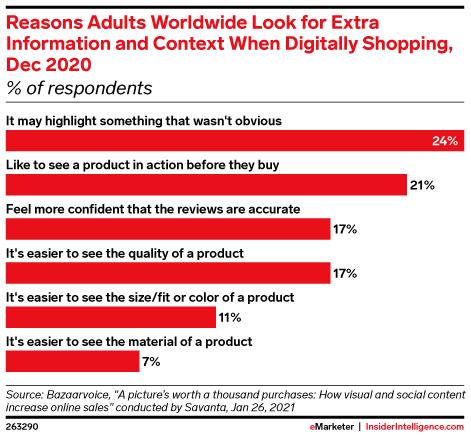
  • It may highlight something that wasn’t obvious (24%)
  • Like to see a product in action before they buy (21%)
  • Feel more confident that the reviews are accurate (17%)
  • It’s easier to see the quality of a product (17%)
  • It’s easier to see the size/fit or color of a product (11%)
  • It’s easier to see the material of a product (7%)

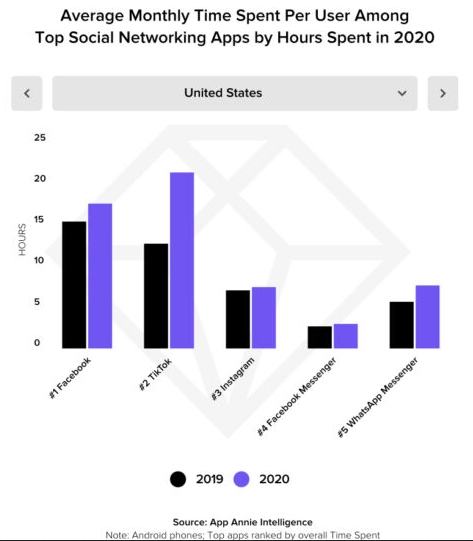
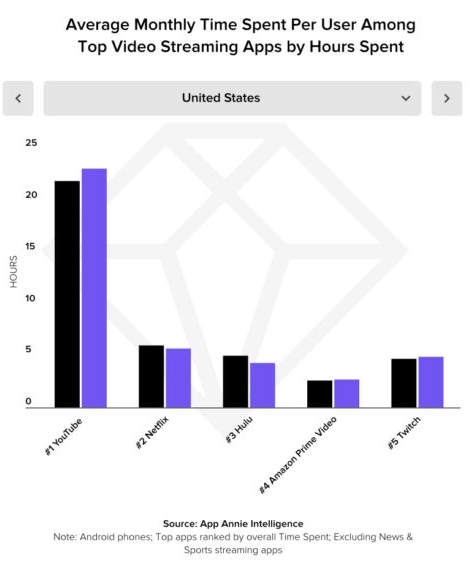
Unsurprisingly, social media is largely where shoppers are finding this type of content. The survey says more than a quarter of respondents pointed to Facebook as the best place to find customer photos or videos, followed by Instagram, YouTube, Pinterest, TikTok, and Snapchat. 

With all this in mind, eMarketer principal analyst Jeremy Goldman believes user-generated content will only grow in importance for brands.

“Consumers are less trusting of the mainstream media and slick corporate marketing, turning instead to user-generated content and influencers to find their own truth.

“Why would brands spend more time and money on large-scale productions when this option exists, particularly in a world where content must be created and shifted quickly?”

Although the report largely identifies social networks as the key place for user-generated content, it is worth noting that many online retailers are also allowing customers to upload images with products directly in their reviews. By doing this, other shoppers can find this type of information without ever having to leave the page to buy your products.

For the longest time, the conventional wisdom has held that Facebook is where people spend the majority of their screen time while using apps. According to a new report from App Annie, however, that has shifted over the past year.

For the first time ever, TikTok has taken the lead as the social app with the longest time spent per user.

Year-over-year, TikTok has leapt 325% in time spent, officially knocking Facebook out of the top spot.

Notably, this does not necessarily mean people are spending less time on Facebook. In fact, nearly every app in every market included in the report has seen increases in the time spent on their platform – likely due to the Coronavirus and social distancing measures.

Still, TikTok’s growth over the past year far outpaced any other platform, allowing it to take the lead compared to any other social app.

With this in mind, it is not a surprise to see that TikTok also took the top spot as the #1 breakout app of 2020 based on monthly active user growth.

Another key finding is that TikTok has risen to the #2 non-gaming apps when it comes to consumer spending. In addition to the traditional advertising services TikTok offers, it brings in additional revenue with purchasable digital goods. Surprisingly, this appears to have been a hit with users, contributing to a swell of revenue.

While this may be one of the most important takeaways from the report for brands trying to keep up with shifting audiences, the report also includes a few other interesting findings:

Mobile Adoption Leaps Forward

Based on App Annie’s data, mobile adoption has leapt forward by 2-3 years over the past year. Nearly every metric related to mobile use spiked.

This includes a 7% year-over-year increase in mobile app downloads, an 8%, which translates to 218 billion app downloads. 

This year also marks the first time Americans have spent more time on their mobile devices than they have spent watching TV. People spent 8% more time on their mobile devices compared to TVs (4 hours a day on mobile vs 3.7 hours watching TV).

People Watch 4x More YouTube Than Netflix

Based on app usage, YouTube is the unquestioned leader in video streaming. The app received more than 4x the time spent on the app per user compared to any other platform. Even Netflix was miles behind Google’s video platform.

Every month, the average user watches 23 hours of content on YouTube, compared to just 5.7 hours of Netflix shows or movies. This makes it clear that YouTube is the platform to focus on if you want to get video content in front of your target audience, whether it takes the form of advertisements or regular content.

The holiday shopping season is starting to heat up as retailers across the country prepare for the onslaught following Thanksgiving.

This year, the holiday shopping season is almost definitely going to look a lot different than in past years. Still, all estimates suggest this year’s holiday sales will be as big as ever.

To help you get prepped, Google is releasing a 27-page guide full of case-studies, useful data, and insightful predictions on this year’s holiday shopping. 

While these bits of info cover a wide range of topics, they broadly fall into 3 categories: search behavior, changes in online shopping, and buying behavior.

Google Search Behavior and Holiday Shopping

In the guide, Google highlights a range of specific search terms that have been shooting up in popularity:

  • Searches for “best affordable” have grown globally by over 60% year-over-year.
  • Searches for “fashion online shopping” are up 600% year-over-year.
  • Searches for “online clothing stores” have increased 100% globally year-over-year.
  • Searches for “available near me” have grown over 100% globally year-over-year.
  • Searches for “curbside pickup” have grown over 3,000% globally year-over-year.
  • Searches for “support local businesses” grew by over 20,000% since last year.

What This Means For You

This data provides two real takeaways for business owners. The first is that Google is seeing a huge influx of new online shoppers – especially when it comes to buying clothes. This leads us to the second takeaway, the COVID-19 pandemic has made many people reluctant to shop in-store, even when they want to support local businesses.

To accommodate this shift in behavior, it is more essential than ever that businesses provide a range of shopping methods including online stores and contactless pickup.

Changes In Shopping Behavior

With this in mind, Google conducted a survey to see how holiday shoppers are adapting to the unique challenges of 2020. Here’s what they found:

  • 69% of US shoppers plan to shop online for the holidays more than in previous years (with more people going online to browse and buy for the very first time.)
  • More than 50% of surveyed US shoppers tried a new shopping service for the first time this year.
  • More than one in ten surveyed US shoppers tried a new shopping app for the first time this year.
  • 70% of US shoppers said they were open to buying from new retailers.

What This Means For You

We are all generally resistant to change, but the reality of this year has everyone outside of their comfort zones and trying new things. This is clear in our shopping behavior.

Not only are shoppers trying new ways to shop, they are opening themselves to buying from new retailers who have stepped up to the challenge. 

Buying Behavior of Holiday Shoppers

The last selection of stats and data turns the attention towards what shoppers are expecting as they enter the holiday shopping season:

  • 62% of US shoppers will start holiday shopping earlier to avoid items being out of stock.
  • 46% of online US shoppers expect retailers to offer discounts.
  • 77% of US holiday shoppers said they would browse for gift ideas online, not in-store.
  • 46% of surveyed US shoppers agreed that “I make a deliberate effort to shop at businesses that align with my values.”
  • 66% of US consumers who plan to shop this holiday season said they will shop more at local small businesses.

What This Means For You

While the swell in people shopping locally online may seem like a broad shift in consumer desires and behavior, it can also be read as a sign that many local shoppers have been pushed online this year. 

Additionally, many consumers are making a concerted effort to support businesses in the community who may be struggling during the pandemic. 

The increase in tension surrounding the elections is also reflected in this data, as many showed they are focused on shopping at places which align with their values. 

To read the full report yourself and get even more insights into the 2020 holiday shopping season, click here

This week, Microsoft announced a free new analytics service called Clarity which aims to walk the line between in-depth insights and user privacy. 

The set of tools is said to be completely GDPR compliant while still digging deep on a wide range of metrics that matter to businesses. 

Doesn’t Slow Your Site Down

One of the biggest aspects of Microsoft Clarity is that it tracks an astonishing amount of non-identifiable data without measurably slowing your web site. Even more surprising is the lack of traffic caps – making Clarity an option even if you’re getting millions of visitors a day. 

As the company says:

“Clarity is designed to have a very low impact on page load times, so you can make sure users navigating to your site won’t have to wait for pages to load.

Additionally, we don’t place any caps on your traffic so whether you get 10 visitors per day or 1,000,000, Clarity will be able to handle your traffic with no additional cost for you.”

Privacy Focused

Despite the amount of information gathered by Clarity, the analytics service still prioritizes privacy. 

According to the announcement:

“We are GDPR compliant as a data controller for visitors to our site and processor for the data gathered by the Clarity script on your site.”

Session Playback

One of the three biggest features highlighted in Clarity is the ability to replay site visitors’ time on your site including where they moved their mouse, where they clicked, and what made them pause.  

This is shown in a simple video recreating the visitor’s browser window with highlighted cursor movement.

Heat Map

While session playbacks allow you to see what single visitors are doing on your site, Clarity’s heat maps will show you what everyone is doing on your site. 

This feature shows what page elements are getting clicked the most and where users are spending the most time on a page. 

This can provide great insights into what is catching people’s attention, and where you are starting to lose them. 

Though not available at launch, the company says they will also feature an option for scrolling metrics in the future, helping understand how users are traveling through your content. 

Insight Dashboard

To help break down and visualize all this information, Clarity includes a dashboard with a wide array of important metrics. 

“We provide a dashboard of aggregate metrics to help you get an overall understanding of the traffic on your site. At a glance you will be able to see how many users were clicking on non-existent links or how many people scrolled up and down a page in search of something they couldn’t readily find.

You can also see things like how many concurrent JavaScript errors are occurring across your clients or how much time the average user spends navigating your site.”

To start using Clarity for yourself, sign up here.

The past six months have seen upheavals in just about every area of life, from schooling, to work, to our daily shopping habits. Now, a report from BrightEdge suggests these shifts are going to continue at unprecedented levels through the holiday shopping season. 

The report, based on an evaluation of eCommerce clients across a wide range of industries predicts a historic online holiday shopping season for a massive range of interests – emphasizing the need to start preparing now. 

What Changed

It’s no secret that the COVID-19 pandemic has forced many to do more online shopping this year. In-store shortages, quarantines, and general concern with public gatherings has made online shopping a go-to choice for both essentials and luxuries.

Interestingly, the analysis suggests that though shoppers are doing significantly more online shopping compared to 2019, the revenue per order remains relatively stable. 

The report offers two theories for why this shift is occurring:

“Here are our hypotheses:

1. Shoppers shifted purchasing behaviors online during the first few weeks of the COVID-19 pandemic and are more keenly aware of their budgets – refraining from placing big-ticket purchases online, while stocking up on more essential goods or affordable luxuries.

2. Shoppers started buying more frequently online after COVID-19, supplanting offline purchases. This would include the buy-online, pickup-curbside behavior that may include cheaper items that were previously always purchased in-store.”

Black Friday Goes Virtual

Another major factor contributing to the predicted surge in online shopping during the 2020 holiday shopping season is the cancellation of many Black Friday events. 

Not only does this mean consumers will be forced to look elsewhere for big deals, it is expected that many retailers will be pushing huge online sales for Black Friday to make up for lost revenue. It is also expected for Cyber Monday to gain an even higher profile this year. 

What You Can Do

With all these factors in mind, BrightEdge has one recommendation for brands trying to regain their footing this holiday season – invest in search engine optimization. 

As the report says:

“An impressive 60% of consumers have been shopping online more often since COVID-19, and of that group, 73% plan to continue after the pandemic. What digital marketers and SEOs have long known is finally coming to fruition: online shopping is convenient and easy. Now the trick is to make SEO important within your organization.”

Other Takeaways

In the conclusion of the report, BrightEdge offered a few key insights into the current behavior of online shopping and what they expect to see in the future:

  • “The research suggests that shoppers browse more frequently, leading to more purchases and overall revenue, though these purchases are smaller in value.
    This could be because shoppers are becoming more aware of their budgets – refraining from placing big-ticket purchases online while stocking up on more essential goods or affordable luxuries.
  • As we enter Q4 and the holiday shopping season, search is helping reveal radical changes in real-time.
  • The traditional customer journey is being radically altered in many industry sectors of the economy.  As a result, it has never been more important to truly understand how consumer behavior and use this understanding to drive engaging experiences.”

To view the full report, check out BrightEdge’s complete holiday shopping guide here.

The COVID-19 pandemic has impacted or changed almost every part of our daily lives in some way, and that holds very true when it comes to online search. 

Google has been tracking these shifts from the initial outbreak to our current time where over 4 billion people are staying home around the world and many in America are returning to work. 

In particular, Google says it has seen five key trends reflecting how online search behavior, consumers’ interests, and purchasing behavior have shifted over the past few months.

The five key trends in online search after COVID-19 include:

  1. More consumers are relying on multiple devices
  2. Increased reliance on Google search
  3. People are using online tools to create and develop virtual relationships
  4. Routines are adjusting to reflect being at home
  5. People are increasingly practicing self-care

Let’s dig into what these trends really mean and reflect:

Multiple Devices

With the huge jump in people working from home or spending extra time relaxing inside, Google has seen a similar increase in the amount of content consumption. Specifically, the company says staying home has led to at least a 60% increase in the amount of digital content watched in the US.

This means many consumers are relying on one device to indulge in their favorite content online while using another device to browse products, look up information, and connect with friends. 

Increased Reliance On Google

The search engine has seen a massive increase in searches for critical information and a wave of content designed to inform the public about safety, updated business practices, and other essential needs.

For example, Google has seen that online search interest for terms like “online grocery shopping” and “grocery delivery” grew 23% year over year in the US. 

Online medical needs have also skyrocketed, with online search interest in telemedicine climbing by 150% week-over-week. 

Building Virtual Relationships

Businesses may be opening, but many are still practicing social distancing which keeps them away from friends and family. In lieu of being able to spend time with loved ones, people are finding new ways to build relationships online:

As of April, Google Meet has hosted at least 3 billion minutes of video meetings, with nearly 3 million new users joining every day. 

Online search shows increased interest in digital recreations of normal social events, such as a rise in search interest for “virtual happy hour” or “with me” content which shows people doing ordinary tasks like cleaning, studying, or cooking. 

Changing Routines

As social distancing and quarantine continues for many, online search interest has shown that many are adapting their typical routines to be internet-first.

For example, search interest for “stationary bicycles” and “dumbbell set” has continued to rise while many try to stay healthy from home. 

Google also reports that search interest for “telecommuting” in the US has continued to grow since it reached an all-time high on Google and YouTube in March.

Practicing Self-Care

To help cope with the mental and physical toll of the COVID-19 epidemic, many are turning to online search to assist in practicing self-care from home. 

Some examples of this from Google’s report include:

  • Views of mediation-related videos are 51% higher in 2020 compared to 2019.
  • Searches for “bored” spiked significantly and have remained heightened since March. 
  • Searches for at-home activities such as “games,” “puzzles,” and “coloring books” have remained increased since March. 

Read the Full Report

The full report includes additional data as well as recommendations for responding to these changes to online search over the past few months. You can read the entire 39-page document here (PDF).

Even before the COVID-19 pandemic, consumer behavior was prone to shifting quickly. Now, it seems buyers’ needs are changing daily – if not hourly. If there is any place this is reflected, it is in our Google searches. 

Product and purchase-related searches have been rapidly evolving as people respond to the daily updates related to the pandemic and their state’s handling of the situation. To help businesses track these changing needs and consumer behaviors, Google is launching a new tool called Rising Retail Categories.

“We’ve heard from our retail and brand manufacturing partners that they are hungry for more insights on how consumer interests are changing, given dynamic fluctuations in consumer demand,” said the company in the announcement.

“That’s why we’re launching a rising retail categories tool on Think with Google. It surfaces fast-growing, product-related categories in Google Search, the locations where they’re growing, and the queries associated with them.”

Specifically, the tool shows the biggest shifts in product-centric search categories, as well as their associated queries and the locations where the product categories are showing making the biggest waves on a weekly, monthly, or yearly basis.

The company also says “this is the first time we have provided this type of insight on the product categories that people are searching for.”

Currently, the Rising Retail Categories tool includes data for the US, UK, and Australia.

In the announcement, Google suggested a few different ways the information could be helpful for brands, including content creation, product promotion, and even the development of new products. 

Pinterest is launching a new tool called Pinterest Trends which will help you see what the hottest search terms have been over the past 12 months, along with info showing when the search terms peaked.

As the company announced, the new feature is in beta, but began rolling out earlier this week.

How Trends Can Help Your Marketing

Marketers and brands have been relying on Google Trends for years to track what the most popular search terms over time, especially surrounding seasonal events. Although Pinterest’s version of this feature doesn’t seek to reinvent the wheel, it does provide another set of compelling data which could be particularly useful for businesses in the fields Pinterest tends to cater to – such as cooking, decorating, fashion, and self-care.

As Pinterest continues to grow into one of the most dominant social platforms available, insights like this will be useful for brands looking to plan their campaigns ahead of time.

The company said as much when describing their goals with the tool:

“Pinterest Trends will help brands get deeper insights into planning behaviors on the platform, and allow  them to allocate budgets to campaigns during various planning stages. It will also validate assumptions about emerging trends, refine search queries with the aid of auto-complete suggestions, and help advertisers find a list of keywords to include or avoid while planning media campaigns.”

For example, the company says that Tastemade and Albertsons were given early access to the tool and have both used the data to create successful boards and campaigns on the site.

New research from Yext and Forbes reinforces just how important it is to keep the information on search engine results relevant to your business accurate and up-to-date. 

The findings from more than 500 US consumers indicates that people automatically assume only half of the information they see in search results is accurate. Additionally, those consumers then hold the brands responsible for any inaccurate information about them, even when it appears outside of your official channels.

The study also revealed a few more bits of interesting information:

  • 57% of respondents say they bypass search and visit a brand’s official website first because they believe the information there will be more complete and accurate.
  • 50% of consumers regularly turn to third-party sites and apps to find information about brands.
  • 48% of those surveyed said a brand’s website is their most trusted source of information.
  • 47% say they are more likely to trust a third-party site over a brand’s website.
  • 20% of current and new customers trust social media to deliver accurate brand information.
  • 28% of consumers avoid buying a brand’s product after seeing inaccurate information.

Marc Ferrentino, Chief Strategy Officer of Yext elaborated on the findings, saying:

”Our research shows that regardless of where they search for information, people expect the answers they find to be consistent and accurate — and they hold brands responsible to ensure this is the case.

… there is a significant opportunity for businesses to differentiate themselves from their competition through verification on and off of their own websites.”

You can download the full report here.

A new large-scale international study from Google shows that shoppers are increasingly using online videos to help make purchasing decisions. 

Specifically, the study – which used a mix of surveys and in-person interviews – found that more than half (55%) of consumers regularly use online videos as part of their shopping research. 

As the company says in its article:

“For more and more shoppers, video is becoming indispensable when they’re ready to buy. In fact, more than 55% of shoppers globally say they use online video while actually shopping in-store.”

Google’s Recommended Strategies For Using Video

Within the article about the report, Google also suggests a few ways brands can use videos to influence online shoppers:

Video Shopping List

One of the most surprising findings of the study is that many consumers are replacing traditional shopping lists with a video. 

“If I go to a store and forget what I need, I pull up the video to see the ingredients. I pull to the side, watch the video, and get what I need,” said one person interviewed. 

Getting Informed and Feeling Confident

For more technical fields or issues, such as finances or repairing complicated machines, videos can be an invaluable way to help shoppers feel more confident about their purchases. 

“YouTube has taught me that I’m capable of doing what I didn’t know I could do,” explained one consumer.

Video Reviews Can Be The Tie-Breaker

Video reviews are one of the most trusted forms of online reviews and are a popular reference point when making purchasing decisions. The wide variety of video reviews out there give people the ability to focus on the features they care most about and see which products will perform best for their needs. 

As one shopper told interviewers, “While I was in Home Depot the other day, I was on YouTube looking up drill sets to see which one was better and which one burned out quicker through stress tests.”

What This Means For Brands

It’s no big surprise that online shoppers are increasingly using videos to influence their shopping decisions. What is surprising is when and where they are referencing these videos and how they are actively using the videos within the shopping process. 

The biggest recommendation from the study is that you “think of ways your brand can show up to meet these in-the-moment needs, whether it’s through ads that spark ideas and inspiration or through more in-depth content to answer questions and help people along their path to purchase.”