Google’s upcoming mobile-friendly algorithm is fast approaching, and many webmasters have questions about exactly what they need to do to prepare their sites ahead of time. This was especially clear in a recent Google+ Webmaster Hangout which allowed some webmasters to directly ask Google employees all their lingering questions on the new mobile update.

There is a lot of good info to be found in the hangout, but I’ve collected some of the most important parts in case you don’t feel like sitting through the hour-long video.

Expect the Rollout to Last a Week

Initially, Google made it seem like the algorithm would be like turning on a switch, but it sounds like the rollout will actually be more similar to past algorithms. Current estimates say it could take up to a week to fully be implemented. Keep this in mind as you start monitoring your traffic starting the 21st.

There is No Grey Area

Your site is either mobile-friendly or it is not. There is no scale or middle ground. If you live up to Google’s criteria you will be considered mobile-friendly, and otherwise your site will be flagged until you make the necessary changes. Thankfully it is easy to know ahead of time if your site is ready for the rollout with a simple testing tool.

Google Yourself to See if You are Ready

Google’s testing tool is the official way to check your site’s status, but you can also see if your site is mobile-friendly with a simple search from your smartphone. According to the experts, if you see a grey “mobile-friendly” label next to your site in the listings, you are all set. On the other hand, if you don’t see that label you should probably get to work.

Common Mistakes

These tips follow a list of common mistakes websites make when going mobile-friendly, which Google recently published. If you aren’t seeing the “mobile-friendly” label, make sure to check out this list to guarantee you aren’t missing a small mistake.

GMB Put On Map

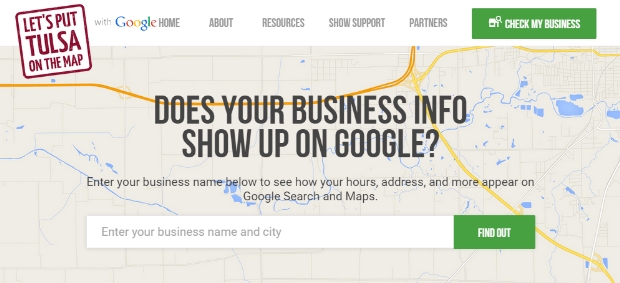
Google is doubling down on their efforts to bring local businesses around the world online with a new program called “Let’s Put Our Cities on the Map.

The new program seeks to assist small businesses and local organizations from over 30,000 cities worldwide to set-up complete local listings on Google.

The search engine claims consumers are 38 percent more likely to visit and 29 more likely to consider purchasing from businesses with complete listings, yet a huge number of companies do not have local business listings on any search engine.

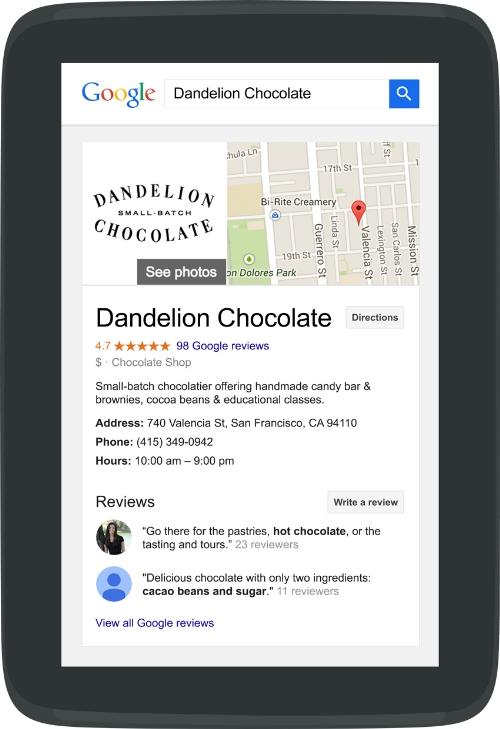
Dandelion Marketing

For the new initiative, Google is providing each participating city with a custom website where local businesses can see how they appear on Google Maps and in search results.

Google is also giving local business owners an easy-to-follow guide for getting their business listed with Google My Business, as well as a free website and domain name for a year through Google’s partner Startlogic.

The program is also encouraging consumers to get involved, by inviting consumers to create postcards in support of their favorite local businesses which can be shared on Google+, Twitter, Facebook, and LinkedIn. However, Google makes it clear these postcards won’t have any impact on search engine ranking.

“Sharing the postcards won’t make businesses appear higher in search, but will hopefully spur them to verify and start managing their business listing,” a Google spokesperson told Search Engine Watch.

Google is also partnering with local organizations such as chambers of commerce and small business development centers to offer workshops aimed at teaching local businesses how to control the information listed about them on Google Search and Maps.

Facebook Messenger

Facebook unveiled several big upgrades to its current platform of products and services this week during its annual developer conference in San Francisco. The biggest announcement has been rumored for some weeks, but the social media giant also had a few other interesting changes hidden up its sleeve that will allow the platform to be more fully integrated with the rest of the internet.

Messenger is a Platform Now

Of course the big news from the conference is Facebook’s decision to officially launch Messenger as its own platform, which will allow developers to more freely integrate features from Messenger into other apps.

For example, Facebook demonstrated how users may be able to order from an online retailer, then change the order or shopping details later using the Messenger app. You can find out more details in the official announcement.

360-Degree Videos are coming

It was announced that spherical, 360-degree videos will be coming to Facebook at some point in the near future. These spherical videos will also be brought to the Oculus VR platform.

Embeddable Facebook Videos

Facebook is quite proud of the success of its video service and it is making it easier than ever to share videos you like from the site. Soon, videos uploaded to Facebook will be embeddable across the web. This provides clearer incentives for content creators to consider uploading videos directly to the social media site rather than through competitive platforms such as YouTube.

SmartphoneNot long ago Google announced its upcoming mobile-friendly algorithm change, but the search engine is making efforts to help webmasters prepare as well as possible. Google has been offering a steady stream of information helping webmasters avoid common mistakes while converting websites to mobile-friendly designs.
After answering questions over Twitter, Google also decided to directly ask webmasters what they were confused about and what problems they were encountering. Then, Google compiled the most common mistakes and shared them in a simple and easy to explore list.

According to Google, the most commonly mentioned mobile mistakes are:

  • Blocked JavaScript, CSS and image files: In order for Googlebot to see your site as a real user would, always allow access to these files in your site’s robots.txt.
  • Unplayable content: This consists of certain types of videos, or other content, that are not playable on mobile devices, such as license-constrained media or media that requires Flash.
  • Faulty redirects: If you have separate mobile URLs, you must redirect mobile users on each desktop URL to the appropriate mobile URL.
  • Mobile-only 404s: Some sites serve content to desktop users accessing a URL but show an error page to mobile users. Instead, redirect mobile users to an equivalent mobile page to avoid 404s.
  • App download interstitials: This is when websites block the view of pages with a prompt to download the site’s native app. Instead, use a small HTML banner at the top of the page.
  • Irrelevant cross-links: This is when users are linked to desktop-optimized pages from the mobile version of the site, and vice versa. Check your links to make sure that they point to the correct equivalent page.
  • Slow mobile pages: In order to avoid user frustration, ensure your mobile pages load quickly. You can check your page speed with Google PageSpeed Insights.

You can learn more from the complete guide here.

Firefox Yahoo

Google has been heavy-handed in trying to woo Firefox users back to their search engine since Yahoo became the default search engine for the browser. It also appears to be working.

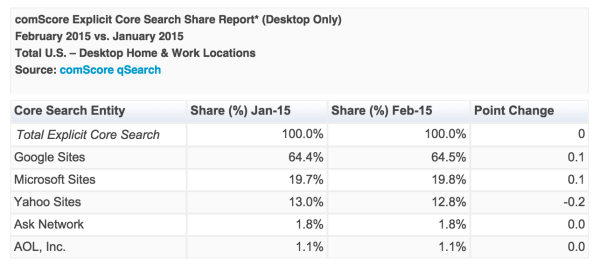
ComScore released the latest US search market share numbers for February and it seems Yahoo is gradually losing the gains they have made since they made a deal to become the default search engine for the browser and Google is reaping the benefits.

Screen-Shot-2015-03-18-at-10.47.35-AM-600x278

Since the switch over lost Google a small portion of users, Google has been practically begging users to make switch back. While there hasn’t been a mass exodus back to the motherland of Google, Yahoo is seemingly losing a slow but steady stream of users back to Google.

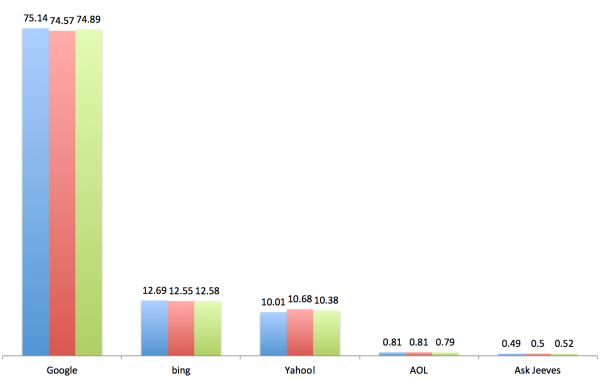
According to comScore’s report, Yahoo lost approximately 10 percent of its search volume from January to February, while Google recouped a tenth of a point along with Bing. This lines up with another recent report from StatCounter which also indicated a loss by Yahoo between January and February.

Screen-Shot-2015-03-18-at-10.57.59-AM-600x379

From the time Yahoo became the primary search engine to January, Yahoo had gained 1.2 points. Now Yahoo is still above their previous levels, but it has list .2 percent of those gains. The question is whether the trend continues.

It is important to note comScore’s numbers don’t include data from mobile searches, where Google is even more dominant.

Google is making it easier for mobile users to fill out forms thanks to a new enhancement to its autocomplete attribute in Chrome, the company announced yesterday.

As in the past it is up to webmasters to make sure the forms on their sites are marked up with the autocomplete attribute, but it is an important step to take. Past analysis shows implementing autocomplete on your forms increases conversions and reduces cart abandonment.

Google also encourages sites to use the autocomplete attribute, citing increased completion rates and saying:

“Making websites friendly and easy to browse for users on mobile devices is very important. We hope to see many forms marked up with the “autocomplete” attribute in the future.”

The new enhanced autocomplete attribute allows you to easily label input element fields with common data categories like ‘name’ or ‘street-address’ without having to alter other aspects of your site. This way, Chrome is able to accurately fill-in each line when users tap on the field from their smartphone or tablet.

Google offered a sample form so you can see get an idea what the new markup code looks like. You can see how each field is marked up by going to this page and viewing the source.

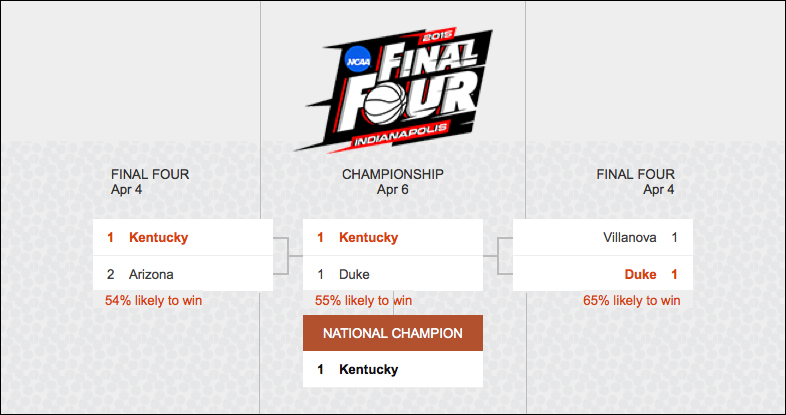
bing-predictions-lentucky-ncaa

The first round of March Madness games begin in earnest tomorrow and Bing is helping you get prepared for the big NCAA tournament. The search engine is offering predictions and tournament brackets so you can gauge the best picks for each match-up and even get in on the action by submitting brackets to the official contest on NCAA.com.

Anyone searching for terms such as “NCAA,” “March Madness,” or “college basketball” will immediately see the entire tournament bracket, as well as Bing’s predictions for every one of the 69 games.

The responsive search features are the result of a partnership between Bing and NCAA announced last week, which allowed Bing greater access to stats and data. According to Bing, the wealth of data took over seven hours of data crunching Sunday evening to prepare their predictions this soon.

In a blog post, Bing Predicts chief Dr. Walter Sun claims there are more than 9.2 permutations involved in the tournament bracket, and explains how Bing used over 10 years of data to inform its predictions.

This includes offensive and defensive statistics, conference success in previous tournaments, the proximity of tournaments to each team’s home campus, the style of each team, their individual strengths and weaknesses, and many other factors which might result in them favoring certain match-ups over others. After ingesting these initial data sets, we applied our analysis of web and social sentiment to tune our predictions, resulting in projected outcomes for each of the 67 games of the tournament, including both predicted winner and probability of the team winning. We then present to you the 1 bracket which we think is the most likely to transpire.

Bing has pegged the Kentucky Wildcats as the team who will take the championship this year, which isn’t exactly a daring prediction given the team’s perfect 34-0 record. Bing’s team of statisticians are not the only team thinking the win streak will leak the Wildcats to win it all. The analysts from Nate Silver’s fivethirtyeight.com give Kentucky a 41 percent chance of winning. For comparison, the second most likely team, Villanova, only received an 11 percent chance.

Bing’s special results page for the tournament also includes game schedules as well as team breakdowns similar to what the search engine showed during last year’s World Cup.

Bing’s partnership with the NCAA has most likely given the search engine a lead on preparing this search feature. Currently searching for anything similar doesn’t show anything special on Google, but that will most likely change before the opening games tomorrow.

Instagram Banner

Is Facebook still the king of social media? In terms of sheer traffic Facebook may still have a sizable lead, but businesses are finding it may not be the best platform for their marketing. In fact, a report by L2 and Olapic shows brands are starting to invest more effort elsewhere.

Brands are now posting more content to Instagram than they are on Facebook, most likely due to the continuously declining organic reach for brands on the big F.

The signs of Facebook’s downfall as the primary place for social media marketing have been around for quite some time. As organic reach started to fall, brands began migrating to other social networks and cutting back on their organic efforts on the site in favor of paid advertising.

Facebook’s paid advertising platform allows brands to get even more reach than they had developed organically, but at the sake of organic reach. In comparison, Instagram is (for now) almost entirely based on organic content.

Instagram may not stay the most popular platform for branded content for long, either. The Facebook-owned social image sharing platform has already implemented some advertising options and have publicly announced plans to expand paid advertising on the site. Nonetheless, most brand activity on the site is currently organic.

L2-instagram-600x322

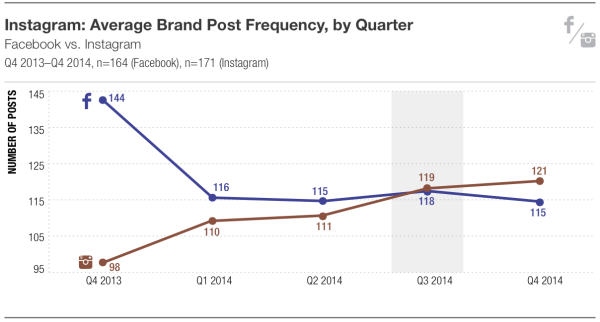
The L2 report found the 250 participating brands posted an average of 9.3 times per week on Instagram compared to 8.8 times on Facebook in Q4 of last year. Compared to the same time period in 2013, Facebook was down from 11.1 a week, while Instagram boosted itself by nearly two full posts a week.

Other notable findings from the report included:

  • The auto industry, led by luxury brands like BMX, Mercedes-Benz, Audi and Porsche, outperformed all categories (Beauty, Consumers Electronics, Travel, Watches & Jewelry, Fashion, Sportswear, Retail, Drinks) with a 1.52% per post engagement rate on Instagram. Drinks — Stella Artois, Jack Daniels, Belvedere, Pabst Blue Ribbon — was second at 1.32%.
  • Of the top 200 highest performing posts, 65% prominently featured a product, 43% included general lifestyle photography and 29% included a brand ambassador or other influencer.
  • Hyperlapse has lapsed with only 75 — or only 2.4% of brand videos posted since August — brand posts using the time-lapse video app. Brand Hyperlapse activity has fallen off steeply since September and the engagement rate on the videos is 0.69 percent, slightly less than conventional Instagram videos.
  • Photo posts drive higher engagement that video, 1.03% to 0.79%. Videos attract more comments, but photos draw significantly more likes.

11057091_1622144431330260_1923819740_n

The best marketing is always informed by data. The more data you have the more you can pinpoint who you should be reaching out to and what they are interested in, and Facebook is making it easier than ever to find out who you audience really is.

Tuesday, Facebook announced it would be granting Page owners access to “topic data” which tells marketers and business owners what audiences are saying on Facebook about all sorts of topics including events, brands, and activities.

Obviously there are some privacy concerns with this type of data, but Facebook says all personal information is being withheld.

With topic data, fashion retailers can see what types and styles of clothing their customers are talking about, and businesses can gauge the public opinion on their brand.

This isn’t the first time marketers and business owners had access to this type of information, but previously they had to use third-party tools to get this level of insight. Facebook also claims that these tools frequently used sample sizes that were too small to be effective and argue it was “nearly impossible” these tools were accurate.

Advertisers should know there is no way to directly use this data to target ads, but it absolutely can be used to craft more effective ads and target them more accurately for your market.


web-design

Do you remember the very first time you ever got online? You might remember the lovely screeching tones of dial-up modems or possibly waiting ages for pages to load, but do you actually remember how the internet looked? (f you don’t, the web site for the movie Space Jam is the closest thing to hopping in a time machine you could ask for.

In an age when online style trends come and go with increasing frequency, it can be easy to forget just how far we’ve come. At the outset of the internet there was no “flat design” or “parallax scrolling.” There weren’t even any images!

In the 25 years since the launch of the World Wide Web we’ve come a long way. The way sites are designed and created has been altered completely to grant designers near infinite freedom with their own webpages, but time has also taught designers that less can be more.

In this infographic, AmeriCommerce explores the exciting history from 1990 to today. You’ll see all the old trends you used to love (and loathe), and you might even learn something new about the technological advances that have facilitated the advancement of the internet to where it is today.

history-web-design-infographic