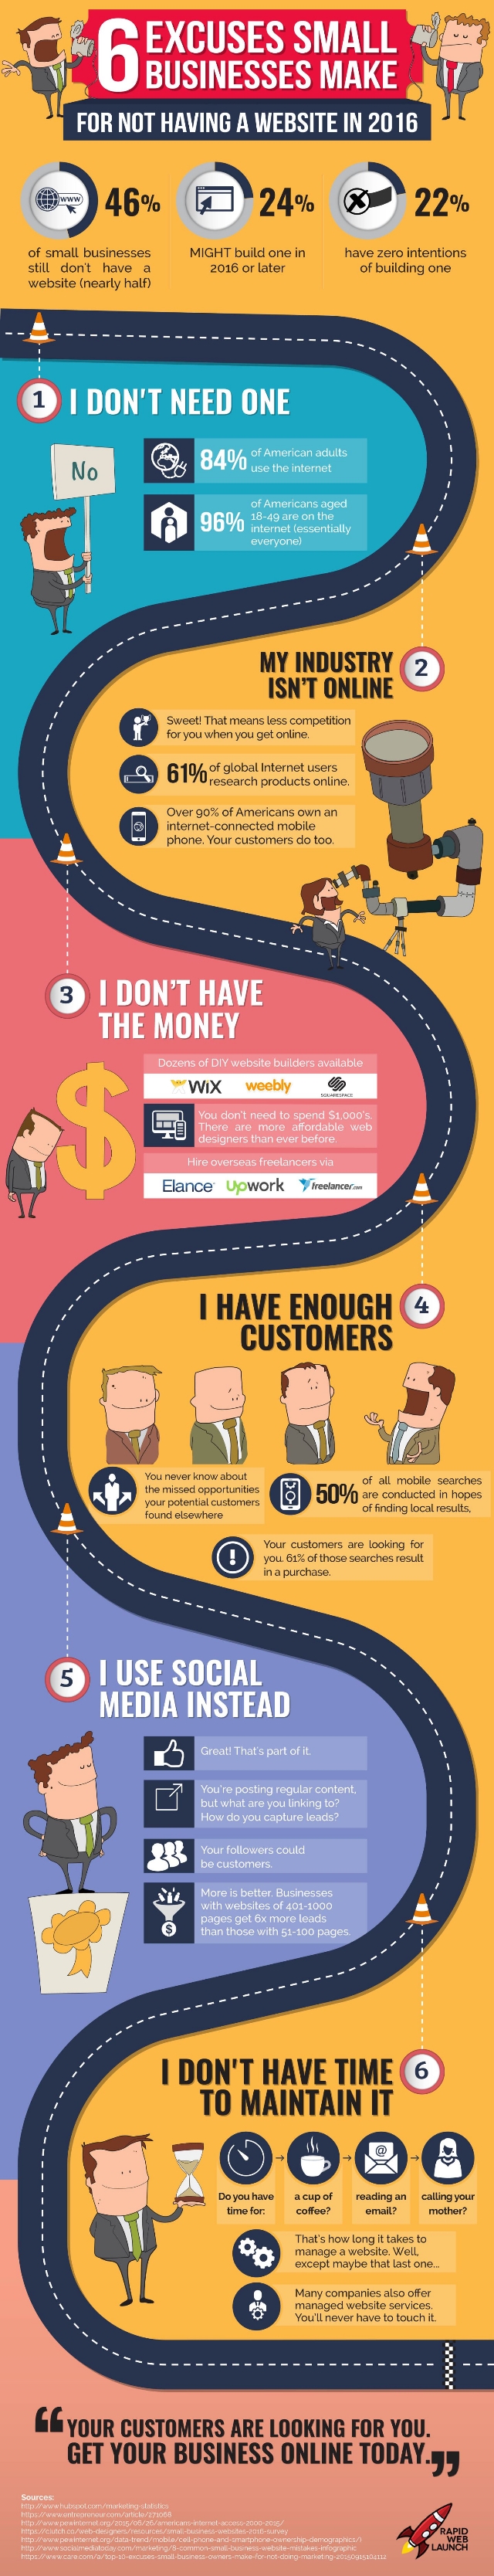
It may seem like everyone is online these days, but somehow some businesses still don’t have websites. Your business might even be one of them.

If your business has gone this long without a website, you probably have your reasons. You may think you don’t have the money or you simply don’t need one. Neither of those is correct.

A website is a fundamental part of running a business in 2016 and many consumers won’t consider purchasing from a business if they can’t find information about them online. That’s true even for brick and mortar stores. In this connected age,people will even Google stores from their parking lot to make sure the trip inside will be worth their time.

Rapid Web Launch put together an infographic breaking down every reason you might have for not having a website and why it is wrong. I know you’ve gone this long without one and your business may be doing fine, but there’s nothing to lose and everything to gain by getting one set up today.

Check out the infographic below or at Rapid Web Launch.

NoWebsite

Keeping a clean and orderly URL structure for your site can be more than just a helpful way of keeping your pages organized. SEO-friendly URL structure can also make your site easier for search engines to index and modestly improve how Google and Bing rank your site.

Unfortunately, establishing the absolute best URL structure can be a bit confusing. Some would have you believe it is more art than magic, while others would argue “everybody is doing it wrong”.

John E. Lincoln from Ignite Visibility and Brian Dean from Backlinko set out to clear up the confusion with a handy infographic that explains the best practices for keeping your URLs easy to index and easy for users to sort through, including the most common questions like URL length and keyword usage.

See the infographic below or at Search Engine Land.

SEOFriendlyURL

It is no secret that visual content is more engaging to readers. Whether you use infographics, social media images, video content, or just creating ads that are visually attractive, users will always react more to content that is more than just text on a screen.

But, just because you are using more visuals in your content and doesn’t mean they automatically work. Aesthetically pleasing content can be a great way to engage users, but you can still lose a huge amount of visitors if your content isn’t compelling and exciting.

To help you guarantee your visual ads are truly visually compelling and engaging, Bannersnack recently shared an infographic breaking down everything you need to know about visual ad creation. If you want to guarantee your visual ads are killing it every time, check out the infographic below or at Bannersnack.

The-ABC-of-Visual-Ads-That-Work.png

Social media has undeniably become one of the strongest channels businesses can use to reach out and engage with their audience. But making social media work for you means knowing which platform works best for your business.

You might think that all social media sites are essentially the same, but making that mistake can mean squandering marketing and ad budgets trying to connect with an audience that just plain isn’t interested.

The truth is every social media platform has a unique audience who interact with each other in ways specifically molded by the site they frequent. Trying to talk to Twitter users the same way you talk to Facebook users will make your message fall flat, while Instagram, Pinterest, and Snapchat users all have their own cultures built from the platform.

So which is right for you? It all depends on your business, your values, and who your audience is. The infographic below from Visage will walk you through the basic pros and cons of each of the most popular social media sites, along with some key stats about each social network.

Identifying the best social network for you will help you get the most out of your marketing efforts and find the most responsive audience for your brand.

pros-cons-social-networks-infographic

Facebook has made itself an absolute necessity for businesses looking to build a following, increase their visibility, engage with their fans, and even find new qualified leads. To get the most out of the most popular social network, however, you need to take advantage of all the newest tools and features Facebook is always rolling out – such as call-to-action buttons on business pages and letting you share company milestones on your profile.

Taking advantage of all these great little tricks and tools not only shows your audience that you are active on Facebook, it shows you care about making sure your fans can always contact you for questions, problems, or to share how much they like your products or services.

So how can you be sure you’re getting the most out of the largest social platform in the world? The tips in this infographic from Cafe Quill will help you get started by showing all the different ways you can be using Facebook to improve your branding and exposure while keeping your fans engaged and invested in your brand.

FacebookBusinessTips

When it comes to social media, less is often more. That is especially the case for word counts of your social media posts and blog articles, according to an infographic recently shared by Express Writers.

Twitter has a cap of 140 characters per tweet, but that doesn’t mean you need to use every character available. The infographic explains that “tweets that are 100 characters or shorter enjoy 17% more engagement than longer tweets.”

“So-called ‘medium-length’ tweets (between 71-100 characters) are re-tweeted more often than large (101 characters or longer) or small (41-71 character) tweets.”

Meanwhile, you may think of Facebook as the place to go for long-form posts and blog-style content, but you would be wrong. In fact, brevity is the soul of Facebook, with the ideal length for a post being just 40 characters or fewer.

“Facebook posts with 40 characters earn 86% more engagement than longer posts,” according to the infographic, and “the second-best length of a Facebook post is 80 characters or fewer. These posts receive 66% more engagement than longer posts.”

Want to make sure your content is hitting the right notes and not exhausting the short-attention spans so prevalent on social media? Find out exactly how long your content should be in the infographic below:

ContentLengthInfographic

While most users still think of Facebook as mostly a way to interact with their friends, post selfies, and share information, many businesses and marketers are starting to realize just how powerful Facebook’s advertising platform is.

While Facebook ads can be an incredibly powerful way to boost your content and your brand’s recognition, it can be hard to stand out among the over 3 million advertisers on the platform.

Creating the perfect ad to rise above the noise and grab the attention of your audience means balancing several different factors, including the optimal amount of text, creating images and videos with the perfect dimensions, and knowing where to best reach users on the page.

For a brand just getting started with Facebook ads, it can all be a little overwhelming. Thankfully, WebpageFX recently shared the infographic below, which details everything you need to know to make the perfect Facebook ad.

facebook-ad-anatomy-infographic

Want to make the perfect Facebook ad for your business and guarantee you reach your audience? TMO can help. Contact us and we can review your advertising efforts and tell you how to optimize them to get the most out of your advertising.

It can be easy to be distracted by the flash and excitement of new marketing mediums and strategies, but there’s a reason some old staples don’t seem to ever go away. Email marketing remains one of the most effective ways to boost sales and connect with your audience. If you want to see true success with your email outreach, you have to break above the noise.

How many unread emails do you have in your inbox right now? According to some estimates, the average businessperson receives 91 emails every single day, and that number is only going up. That means you have to make your emails worthy of your customer’s time and exciting enough to get their attention.

So how do you make sure your emails get opened instead of shipped off to the spam folder or left unread in inbox purgatory? Online Course Report broke down what makes a successful email outreach campaign and put together a handy infographic that details everything you need to know, from what day and time is best to send to how to craft the perfect subject lines.

Check it out below or over at Online Course Report.

 anatomy_of_email_outreach-1

Valentine’s Day is just over the horizon, and many people are just starting to plan their romantic evening and searching for the perfect gift for their sweethearts. For many industries, such as flowers and gift cards, this week is their biggest shopping period of the year.

The US floral industry alone is predicted to rake in $3.3 billion by Valentine’s Day. Whether you sell romantic gifts online, provide romantic getaways for couples, or are a local restaurant, now is the perfect time to boost your holiday sales.

This infographic from The Shelf can help you make the most of the romantic holiday with insight into shopper behavior and the best ways to enhance your online marketing strategies for Valentine’s Day.

You can see the infographic below or at The Shelf’s site.

ValentinesDayInfographic

Google is always changing. Over just the past few years, the way search works has changed radically – moving to a more user-based model and mobile-first mindset.

This shift in attitudes has changed how the world’s most famous search engine works down to its very foundation, with the intent of moving away from a system that started with information and aimed to connect it with its audience. Instead, Google has made it its philosophy to start with the user and aim to provide the best search results for them.

SEOBook recently shared an infographic to visualize how Google’s search engine works in 2016. It shows that in SEO and Google Search, you can’t rely on the same methods from 2013 to keep your business growing online today.

You can see the infographic below. If you can’t see the small text, a larger version is available at SEOBook.

howsearchworks