Tag Archive for: YouTube analytics

YouTube recently revealed new ways to see what search queries are leading viewers to videos, including both videos on your own channel and across the wider YouTube audience through an experimental new feature called Search Insights.

Additionally, Search Insights can help creators identify content gaps where users aren’t finding content ideal for their searches, to plan your future content around.

What Is YouTube Search Insights?

As detailed on the YouTube Creator’s Insider channel last week, YouTube Search Insights allows users to explore search data across the platform from the past 28 days, provided there is enough data.

The feature is split across two tabs. The first tab focuses on your channel and how users find your content, while the second shows keyword data from thousands of topics on the platform.

Along with the expected query data, such as search volume and high volume search topics, YouTube is also experimenting with identifying “content gaps”. This is when a viewer can’t find the content they were looking for with a query.

Do You Have Access?

As an ongoing test, YouTube has not opened these new features to all users. 

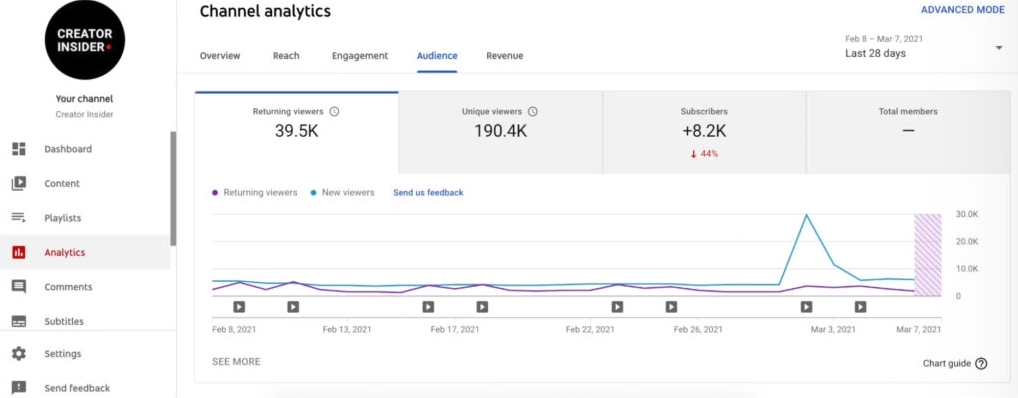
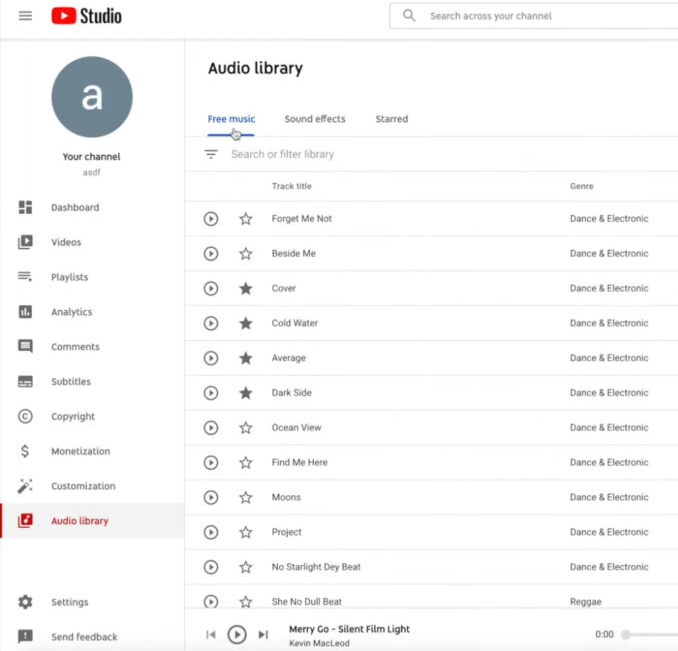
To see if you have access to Search Insights, first, log into YouTube Studio and select “Analytics” from the menu on the left.

Within the Analytics tab, look for a section called “Research”. If you have access to Search Insights, you will then see three tabs: “Your viewers’ searches”, “searchers across YouTube”, and “saved searches.”

While the new feature is in its early stages, YouTube says it will have more information in the future when it expands access to more users or you can watch the full announcement below:

YouTube is expanding the amount of data available to video creators while rolling out an updated version of the YouTube Studio Mobile app.

Accompanying the release of the updated app, the video platform is offering video creators new information on traffic sources, returning viewers, and more in-depth data on how viewers are watching your content. 

Below we are going to dig into the new metrics and app in-depth:

Expanded Viewer Data In YouTube Studio

Living Room Impressions

Before the end of the month, YouTube says it will start showing creators data on what it is calling “living room impressions” or views coming from TV-based sources like built-in TV apps, Rokus, or video game consoles. 

Of course, YouTube has already been counting these streams within its broader metrics like watch time and total views. However, this allows you to see exactly how your viewers are engaging with your content and help optimize your videos for where most people are viewing them.

New or Returning Viewers

Though you have been able to see how many new subscribers you are getting since seemingly forever ago, YouTube has generally overlooked the group of viewers who keep returning to channels even if they aren’t actually subscribed. In many ways, these viewers can be more valuable because they are actively searching out your content on a regular basis, rather than simply relying on it to pop up in their feed.

Now, YouTube is introducing a metric breaking down which viewers are new to your channel and who is returning – whether they are subscribed or not. 

Not only does this provide a more accurate view of your channel’s health and community engagement, it also helps you plan topics based on past viewer response. 

Despite this data being available to the vast majority of creators, YouTube says it will not be present for copyrighted content owners or artistic channels. 

Updates to YouTube Studio Mobile

Redesigned Real-Time Data Card

YouTube is updating its real-time analytics card in the Studio Mobile app analytics section to make it easier to see exactly how specific videos are performing in the moment. These changes include:

  • Thumbnails: The real-time card now displays thumbnails for individual videos.
  • Sorting: The real-time card now sorts videos by view count rather than the date videos were published.
  • Amount of videos: The card now shows up to 15 videos – ten more than the previous limit of five videos.

Updates to Tabs

Along with the new data, YouTube is redesigning its tabs in the Studio Mobile app with a larger focus on alignment. Following the update, all the most-used tabs are aligned, including audience, reach, engagement, overview, and revenue.

At the same time, the company has removed a few cards from these tabs, saying the cards were rarely used on mobile. All of these sections are still fully visible on desktop.

For more information on the new metrics available and the refreshed app, watch the Creator Insider video below:

According to an update on the YouTube Help page, Google Analytics has stopped collecting new data from YouTube channels beginning February 1st. 

While older data is still available, any new information will be available solely through YouTube Studio. 

The change doesn’t come as a particularly big surprise. Users lost the ability to link Google Analytics and YouTube pages in November of last year. However, connected channels were able to keep tracking data from YouTube until now. 

Most likely already rely on YouTube Analytics for monitoring their channel performance, as it has always offered significantly more information compared to what could be found in Google Analytics. The ability to track major YouTube metrics through Google’s tool set was more about conveniently checking both platforms at the same time. 

Still, those affected received little warning about the change. The only information relating to the decision was buried in a YouTube Help page. 

What You Should Know About YouTube Analytics

While YouTube Analytics offers all the information you have come to expect from Google Analytics (and more), there are a couple key differences. 

Most importantly, you don’t have to add any tracking code, pixels, or anything else to get your data. YouTube collects information about engagement, views, and more for your channel and videos automatically. 

You will also find more granular information, with everything from specific audience details for every video on your channel, revenue information, and search terms used to find your channel. 

All of this is collected within five main tabs:

  • Overview: This section collects essential broad metrics for your channel, like watch time, total views, and subscribers. Here you will find reports addressing top videos, realtime activity, latest videos, and average performance. 
  • Reach: The ‘Reach’ tab shows your overall connection with YouTube users with data on impressions and clicks. Users can get reports for traffic source types, top external sources, impressions, and search terms in this section.
  • Engagement: Now, we start moving deeper to exactly what your viewers are watching on your channel as shown by total watch minutes. Read reports for top videos and playlists, top cards, and end screens here.
  • Audience: Explore who your viewers are with data on unique viewers, average videos watched per viewer, and overall subscriber growth. Reports included here cover audience location, demographics, and other channels they interact with. 
  • Revenue: If you are a member of the YouTube Partner Program, you will also find this tab that addresses how much money is being generated through monetized videos. 

For a brief guide on YouTube Studio Analytics, watch the video from the YouTube Creators channel below:

YouTube is giving video publishers new insights into where their views are coming from with a new report in YouTube Analytics. 

As explained in the latest update on the Creator Insider channel, YouTube’s team says the new report will make it easier to see where people are finding your videos along with what is overperforming and underperforming. 

The new data is directly viewable in the Overview area of the Analytics tab in YouTube Studio. 

In the section called “How viewers found this video”, you’ll find details on the percentage of views generated by each traffic source along with the overall number of viewers from each source. 

Currently, the sources in the report include: 

  • Notifications
  • Subscriptions feed
  • YouTube recommendations
    • YouTube Home
    • Up next
  • Channel pages

There is also a category labeled “Other” which would include any other traffic sources like links sent between friends or random placements. 

Along with the raw data on traffic sources, the report includes a green arrow, grey arrow, or dash next to each source. This reflects how the traffic source is performing compared to other videos on your channel. 

A green upward pointing arrow indicates the traffic source is performing better than usual. A sash or no indicator would suggest either the traffic source is performing about the same as usual, or the system does not have enough data to estimate the relative performance of that source. 

Lastly, a grey downward arrow says that source is underperforming. 

While it is perfectly normal for the traffic sources for each video to vary based on a number of factors, consistently low numbers from a source may show you need to invest efforts to improve in that area. 

For example, you might find that subscribers are not returning to your latest videos – suggesting your latest topics are not as relevant to their interests. 

Also mentioned – New Free YouTube Audio Library

In the same video, the Creator Insider channel revealed that YouTube is providing creators with a free collection of thousands of songs and sound effects to use in your videos. 

This should make it immeasurably simpler for video creators to find copyright-free music and ensure your video will not be penalized or removed for licensing issues. 

Most importantly for those driving revenue through YouTube, you can still monetize videos when using the licensed audio from the YouTube audio library.

YouTube is expanding its analytics tools to allow content creators and channel managers to better compare their metrics against other data and competitors.

Specifically, the company is changing how its “Deep Dive” section of analytics functions by allowing you to compare multiple metrics side-by-side simultaneously.

Deep Dive Data

The Deep Dive section is designed to allow creators to compare their channel’s and video’s performance over time. It can be found after clicking the “see more” button next to any metrics in your overview screen.

Initially, this section only allowed video managers to view the performance of a single metric at a time – such as their video views over time.

Now, you can view multiple metrics at the same time within the same graph, making it easier to get an understanding of how specific metrics improve your overall channel’s performance or how some metrics feed others.

For example, YouTube recommends checking out the comparison of ‘views versus comments’ to show if some videos are getting more or less comments compared to other videos with similar view counts.

Another recommended comparison is the chart of ‘views versus revenue’ if you are monetizing your content.

Other Ways To Compare Data

Along with allowing you to monitor several metrics at once, the Deep Dive section is being improved to make it possible to compare a few other types of data, such as:

  • Period over period: Compare month versus month performance, or year versus year.
  • Top videos: Compare a channel’s overall top videos from one month over another.
  • Audience: A geographic comparison shows where your audience is coming from month to month.

For more information about the new analytics comparison features and other upcoming improvements to YouTube analytics, check out the full video below: