Tag Archive for: infographic

How long does your website take to load? If it takes more than three seconds, you’re likely losing more than half of your visitors.

It is no secret that everyone wants everything as fast as possible. That is especially true on the web. The faster your page loads, the more people will stick around and the happier they will be with their experience.

What you might not know, is that your site speed can directly affect your conversions and sales.

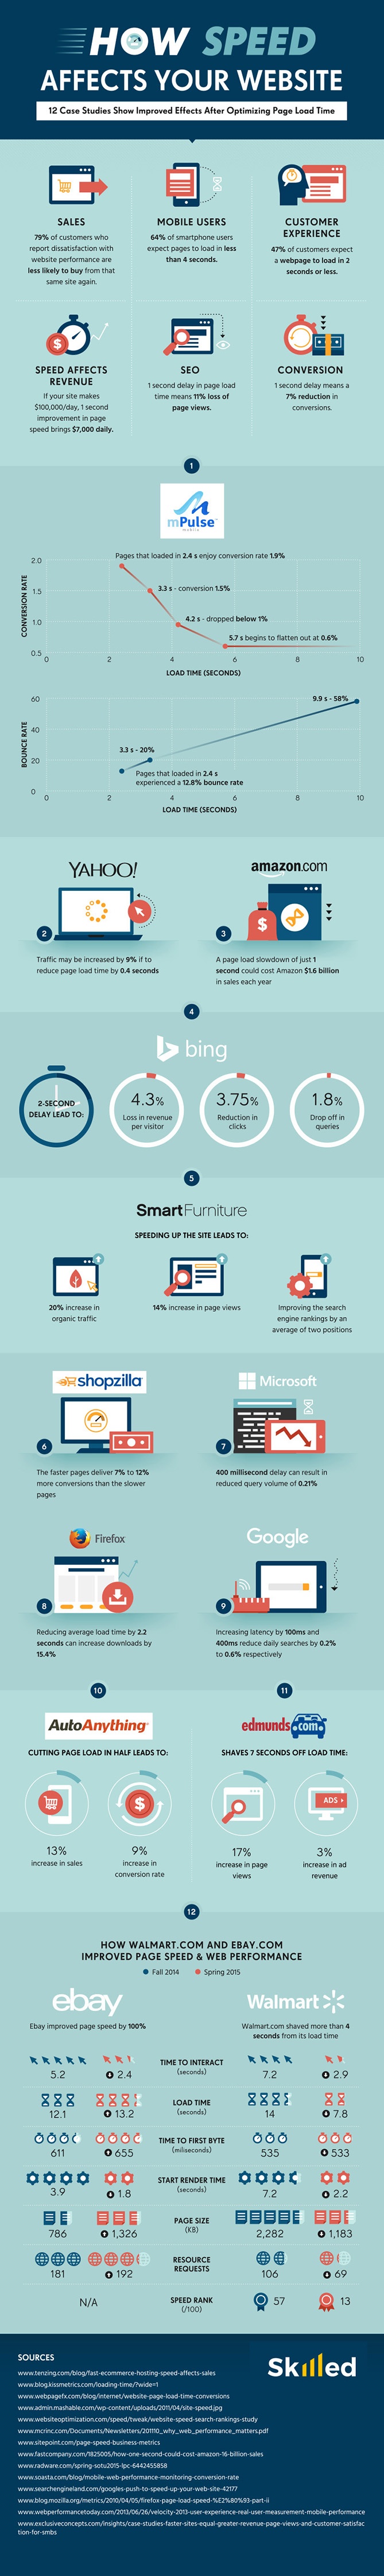
Data from Kissmetrics shows that up to 79% of customers who aren’t satisfied with your site’s performance say they are less likely to buy from the same site again. Taking that a step further, many first-time customers may leave before they ever get a chance to see what you have to offer in the first place.

Web Development agency Skilled collected 12 case studies from real businesses in an infographic showing just how powerful page load time really is. If you’ve ever doubted the importance of keeping your site optimized to be as fast as possible, you’ll likely be a believer after seeing these:

Page Speed

Millenials

Every few weeks I hear an influential figure in marketing talk about some new, creative strategy for reaching millennials. “You need apps!” “You need to be on this social platform!” “Cat Pictures!” “Video!”

Sure, these can all work when done right, but it raises a question: Are millennials really that hard to market to?

As Thomas Sychterz, CEO of LaunchLeap, puts it, “[Millennials] get treated like some sort of hyperactive group of wild gorillas: powerful, unpredictable and difficult to pin down. The reality is quite different and simple.”

To show this, LaunchLeap, a Montreal-based consumer research startup, surveyed 18 – 35-year-olds about their internet and advertising preferences. The results definitely differ from what many would expect. Millennials aren’t as averse to more traditional forms of marketing as you’d think.

“Millennials are open to connecting with brands, drawn to bite-size content (paid or not) and intrigued by new information, product-wise. However, the main caveat is that it all needs to get done in an ergonomic, digestible and fluid manner.”

See the results of LaunchLeap’s survey in an infographic published on AdWeek below:

Millennial Marketing

Instagram is still typically thought of as a niche social platform. But, with over 300 million daily active users and counting, the Facebook-owned app is far from a scrappy upstart.  It’s a hugely popular platform that is still being overlooked by advertisers and brands.

Brands that incorporate Instagram into their social media strategy have been shown to receive high levels of engagement and brand awareness. Even more, the platform has been shown to be a powerful lead generation tool.

These aren’t the only reasons your brand could benefit from being on Instagram. In fact, Buzzoid compiled 22 reasons you should consider the platform into a stylish infographic. Check it out below, or at Buzzoid’s site.

instagram-stats-infographic

Google is always changing. Over just the past few years, the way search works has changed radically – moving to a more user-based model and mobile-first mindset.

This shift in attitudes has changed how the world’s most famous search engine works down to its very foundation, with the intent of moving away from a system that started with information and aimed to connect it with its audience. Instead, Google has made it its philosophy to start with the user and aim to provide the best search results for them.

SEOBook recently shared an infographic to visualize how Google’s search engine works in 2016. It shows that in SEO and Google Search, you can’t rely on the same methods from 2013 to keep your business growing online today.

You can see the infographic below. If you can’t see the small text, a larger version is available at SEOBook.

howsearchworks

With 2016 looming, it can be tempting to kick back and celebrate the New Year and successful holiday season. But, as any seasoned marketer can tell you, there is never any time for rest in the world of SEO.

The past year has seen huge changes in the world of SEO, with a newly emboldened emphasis on mobile optimization and responsive design, the change to 3-pack results in local search, and the expected new algorithms running over at Google.

With that in mind, it’s time to start looking forward and preparing for a booming 2016 by predicting the biggest trends likely to define the coming year. CJG Digital Marketing is doing just that with a new infographic detailing the hottest SEO trends in 2016.

See the infographic below, or at CJG’s website.

Hottest-SEO-Trends-in-2016

On their own, individual marketing strategies like email marketing or focusing on social media can be very powerful in helping a brand grow, but too often companies forget that these strategies can be significantly more powerful on their own.

Email marketing and social media may not seem like the most compatible pair of marketing strategies to create marketing synergy, but in actuality the two go together like a horse and a carriage.  The key is doing it the right way.

The infographic below from ReachMail shows how integrating your email and social media marketing can produce great results and how to do it right.

email-social-media

It is astounding just how much of an impact 140 characters can have. Twitter can be a powerful tool for reaching out and engaging with your audience or even growing a new audience that didn’t exist before, but it can also be a powerful tool for destroying your brand’s reputation.

Countless small businesses have been brought down by social media catastrophes, but it doesn’t require a large-scale meltdown to damage your brand on the social platform. All it takes is poor social media etiquette and before long you’ll find yourself facing a ghost town on your Twitter dashboard.

Thankfully, it is also incredibly easy to stay on the good side of Twitter users so long as you use a little common sense in interacting with your followers.

This infographic from Melonie Dodaro will help you mind your P’s and Q’s and build a positive atmosphere that will make Twitter users look forward to your every tweet.

twitter-manners

web-design

Do you remember the very first time you ever got online? You might remember the lovely screeching tones of dial-up modems or possibly waiting ages for pages to load, but do you actually remember how the internet looked? (f you don’t, the web site for the movie Space Jam is the closest thing to hopping in a time machine you could ask for.

In an age when online style trends come and go with increasing frequency, it can be easy to forget just how far we’ve come. At the outset of the internet there was no “flat design” or “parallax scrolling.” There weren’t even any images!

In the 25 years since the launch of the World Wide Web we’ve come a long way. The way sites are designed and created has been altered completely to grant designers near infinite freedom with their own webpages, but time has also taught designers that less can be more.

In this infographic, AmeriCommerce explores the exciting history from 1990 to today. You’ll see all the old trends you used to love (and loathe), and you might even learn something new about the technological advances that have facilitated the advancement of the internet to where it is today.

history-web-design-infographic


While Facebook may be the most popular social media platform, some brands are discovering Twitter can be just as effective for growing your business and turning followers into leads and sales. However, it isn’t always easy to start building a real fruitful presence on the site.

According to Search Engine Journal, only 34% of marketers on Twitter are successful at finding leads on Twitter. Does that mean the hugely popular service isn’t fertile land for marketing? Not necessarily. You just have to understand Twitter before you can expect to start finding good leads.

Too many companies just Tweet whatever they can think of without any sort of strategy. But if you take the time to learn the ropes and see what works and what doesn’t, you can start Tweeting with a purpose and drawing in loads of quality leads.

Over the weekend, HubSpot and Market Domination Media released this infographic filled with useful tips and statistics that can help you craft a game plan so you can turn Twitter into a lead generating machine with a little time and testing to find what works best for you.

 Twitter Conversions Infographic

Tulsa Marketing Online has always believed tracking data is one of the most essential steps to running an informed marketing campaign, but apparently many search marketers are opting out of comprehensive tracking when it comes to phone conversions from search campaigns.

A new survey from Invoca has found that just 36 percent of respondents reported using call extensions or click-to-call ads in their search campaigns. Of course, call conversions aren’t a major metric for some campaigns, but the survey shows that isn’t the whole story. The results also show that 63 percent of those surveyed said phone leads are equally or more valuable than web conversions.

It is surprising that such only a relatively small percentage of marketers may not be tracking phone call conversion data, especially in light of the wealth of studies showing the value of phone calls to search marketers. Google’s numbers say that 70 percent of mobile searchers have called a business directly from the search results page and BIA/Kelsey estimates inbound calls from mobile search is going to almost double between now and 2016.

The only real explanation is that a fair portion of marketers simply aren’t considering the value of call conversions and how search marketing may be driving calls.

Without data on call conversions, it is hard to get the full picture of how campaigns and marketing strategies are performing and budgets may be getting misplaced or outright wasted. When you have all that information at your fingertips, it is easier to make truly informed decisions about your future strategies and ensure that marketing budgets are being used to their full potential.

You can read Invoca’s full report here and see their related infographic below.

Call Tracking Infographic