Tag Archive for: social media

Social media is all about crafting an image and that starts at the profile and cover photos. These pictures are the first things visitors see when they come to your profile, and it is essential to maintain a consistent image across social media. Unfortunately, trying to prepare your photos in the ideal sizes and specifications for the wide array of social media platforms can be a headache.

Every single social media site has their own specific sizes for images and many of the specs can seem almost random. Facebook requires 851px by 315px, while Google calls for 1080px by 608px and images on LinkedIn are supposed to be 646px by 220px. You can spend your time trying to come up with a mnemonic device to try to keep all the different image specs straight, but chances are your time is better spent elsewhere.

Thankfully, the team at Spredfast created a handy infographic which lays out the most recent photo specs for pretty much any social network you are likely to be on. The graphic details all the ideal photo sizes for profile pics and cover photos, as well as detailing the optimal sizes for posting photos to make sure cropping won’t ruin the image.

 Social Image Size Infographic

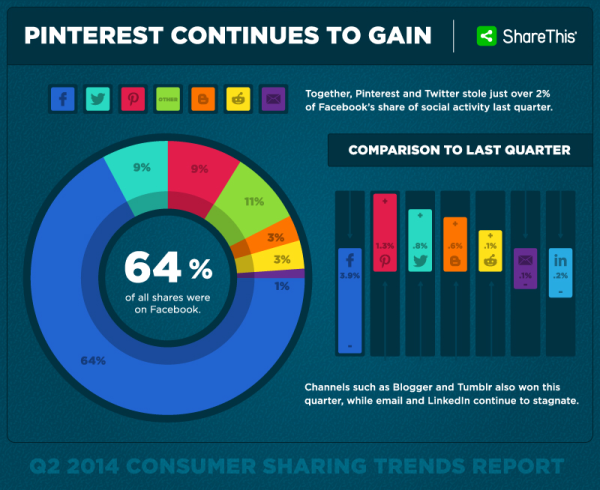
Over the past year, more than a few people have predicted the death of Facebook. They cite the shrinking number of teens signing up for the social site and the increasing difficulty for brands to get organic exposure as proof the end is near. But, a new report from Shareaholic show Facebook is still going strong.

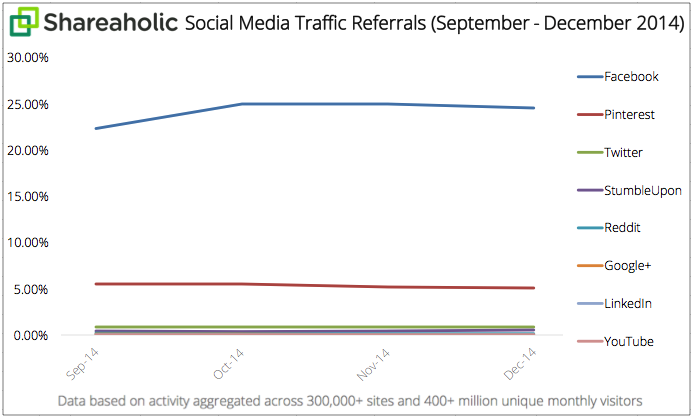
Facebook has consistently been the leader in social referral traffic for years, and their share of traffic referrals is only growing especially during the last quarter of 2014. In fact, Shareaholic’s data suggests Facebook may be responsible for nearly a quarter of all traffic online.

Social-Media-Traffic-Referrals-Report-Q4-2014-graph

The most popular social media site reached over 25% of the total share of visits to Shareaholic’s network through October and December, however it fell to 24.64% in December. Overall the site gained 2.27 percent since the third quarter.

The report confirms Pinterest’s popularity, as the data showed the site in second place. Still, even Pinterest can’t compete with Facebook’s share of traffic referrals. Pinterest’s share was only 5.06%, nearly five times less than Facebook.

SEO is an essential part of growing your business online, but it can often seem impossible to keep up with the constantly changing trends and policies. With the never-ending changes coming from Google and the other major search engines, you could drive yourself crazy trying to react to every single update.

Thankfully, a recent infographic from CJG Digital Marketing breaks down the most important trends and changes coming for SEO in 2015. With these tips, you won’t have to fight to keep up to date with the latest changes because you’ll be prepared before they even happen.

 Top-8-SEO-Trends-to-Watch-Out-this-2015

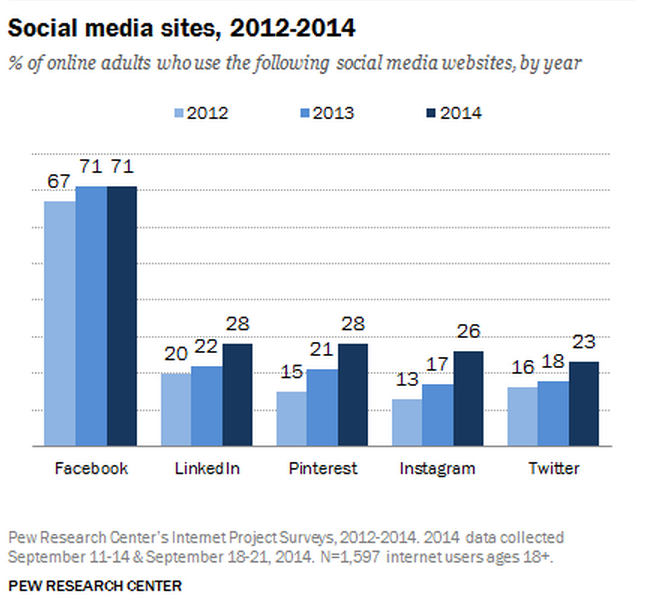
Facebook may still be the most popular social media site, but Instagram is easily the fastest growing site, according to a new survey released by Pew Research Internet Project.

The survey shows the most popular social media site’s growth may be stagnating, but their most recent changes seem to be improving engagement.

pew-social-20141

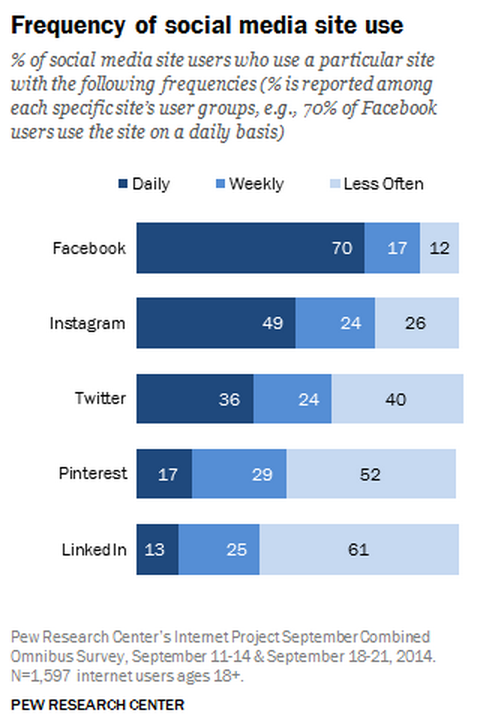
The Pew numbers suggest Facebook facilitates the most engagement of any social platform, as 70% of users fully engage with the site daily. That’s a notable increase from 63% last year. In comparison, only 49 percent of Instagram users and 17 percent of Pinterest users engage with the sites on a daily basis.

While Instagram is unable to draw the engagement levels of Facebook, they outpace anyone in the market when it comes to attracting new users. Over the past year, the number of American adults using Instagram rose 9 percent. That means 26 percent of all adults in the U.S. now use the site.

pew-social-frequency-2014

In comparison to, Pinterest only grew 7 percent, LinkedIn grew by 6 percent, and Twitter grew by 5 percent. Instagram’s huge rise shouldn’t be too surprising, as they recently announced reaching 300 million monthly active users, surpassing Twitter for the first time.

Some other interesting findings in the report:

  • Daily use of Twitter dropped 10 percentage points to 36%. Twenty-two percent say they check the site several times a day, 24% a few times a week and 40% less often.
  • Instagram showed statistically significant growth across all age demographics, while still skewing younger. Notably 53% of younger adults (18-29) use the service, up from 37% in 2013. Instagram users are very active; 49% say they use the site daily, 32% several times a day and 24% weekly.
  • Pinterest is still favored mostly by women, with 42% of all online U.S. females saying they are Pinterest users. That’s up from 33% the year before. Men, on the other hand, are still lagging at 13%, an increase of 5 points over 2013.
  • LinkedIn users are coming to the site less often with weekly users dropping to 25% from 34% and those who visit every few weeks or less increasing to 61% from 52% the previous year. Users of the career-oriented network still skew older, higher income and college educated (50% of college graduates — an increase of 12 percentage points from 2013 — use LinkedIn).

As the year comes to a close, countless companies are releasing their 2014 recaps and best-of-lists, including Facebook and Twitter who have both recently released their year in review which highlights the top trends, topics, locations, and content across social media his year.

 Facebook

Facebook Banner

Here are the top updates, trends and locations on Facebook in 2014:

Top Global Topics

  1. World Cup
  2. Ebola virus outbreak
  3. Elections in Brazil
  4. Robin Williams
  5. Ice Bucket Challenge
  6. Conflict in Gaza
  7. Malaysia Airlines
  8. Super Bowl
  9. Michael Brown/Ferguson
  10. Sochi Winter Olympics

Most Talked About US Topics

  1. Ebola virus outbreak
  2. Ice Bucket Challenge
  3. Robin Williams
  4. Super Bowl
  5. Michael Brown/Ferguson
  6. World Cup
  7. Conflict in Gaza
  8. US midterm elections
  9. Malaysia Airlines
  10. ISIS

Most Checked-Into US Locations

  1. Disney properties
  2. Universal Studios Hollywood
  3. Times Square
  4. Yosemite National Park
  5. Grand Canyon National Park
  6. Yellowstone National Park
  7. Yankee Stadium
  8. Las Vegas Strip
  9. Hollywood Walk of Fame
  10. Madison Square Garden

Twitter

Twitter Banner

Using the site 2014.twitter.com, Twitter has released their top moments and perspectives of 2014 that can be juxtaposed with previous years. Here are some highlights:

The Golden Tweet (Most Retweeted)

Most Talked About Global Moments

  • World Cup
  • #BringBackOurGirls (Nigeria kidnapping hashtag)
  • #IndyRef (Scottish referendum on UK Independence hashtag)
  • Hong Kong Protests
  • #BlackLivesMatter (Social support against Ferguson decision hashtag)

Most Noteworthy Tweets of 2014

Twitter also shared a collection of the most noteworthy Tweets of 2014. That featured the following content from brands/organizations:

Instagram LogoInstagram is quickly becoming one of the most popular social media platforms around. With new estimates saying Instagram pulls in 300 million monthly users, the photo- and video-sharing app has bypassed Twitter’s official user count of 284 million. The new numbers mark a 100 million user increase since March.
The company announced the milestone yesterday, along with the announcing that Instagram would begin verifying accounts similar to Twitter’s method of certify celebrity or high-profile accounts.

The verified badges for public figures and brands will be coming within the week according to Instagram, who says the badges “will make it easier for people to identify and follow the authentic brands they care about.” The blue badges will appear next to names on their profile pages, as well as in search.

The increase in users leaves only a few social media sites ahead of Instagram, including Google+, LinkedIn, and Instagram’s companion company Facebook. The site is extraordinarily popular among youth and brands, and predictions see it continuing its fast growth.

In the announcement, Instagram also said it would be purging fake accounts from the site, so brands can expect to see a relatively small follow count decline.

With its ever decreasing organic reach, Facebook is putting a lot of attention into their paid ad platform, especially the ads shown on mobile devices. Now, the reporting side of Facebook’s paid ad is getting improved to reflect the huge increases in mobile ads in recent times.

One of these improvements is the launch of cross-device reporting for Facebook ads. Now Facebook advertisers are able to see how users move throughout their sales process, even if they move across devices. The announcement described just how advertisers may benefit:

Imagine seeing an ad for a product on your mobile phone while in line at the bank. Do you immediately make a purchase on your phone? Probably not. But perhaps you go back to your office later that day and buy on your desktop computer. Such cross-device conversions are becoming increasingly common as people move between their phones, tablets and desktop computers to interact with businesses.

Cross-device reporting allows advertisers to be able to see which devices ads were viewed on, and on which devices conversions subsequently occurred. That means you can see how many people clicked an ad on iPhone but then later finished their conversion on desktop, and vice-versa.

In a recent analysis of US Facebook campaigns, it was found that of the people who show interest in a mobile Facebook ad before converting, over 32% converted on desktop within 28 days.

You can view the cross-device conversions for campaigns by going to your Facebook Ad Reports, where you will click Edit Columns, and select Cross-Device on the left-hand menu.

Source: Wikimedia Commons

Source: Wikimedia Commons

Brands have been complaining for quite some time that their Facebook engagement has been plummeting, especially for smaller brands who rely on organic reach to connect with their audience. Of course, plenty of analysts and SEO “gurus” have offered their fair share of strategies for increasing engagement, but most of these can be very expensive. Some would even cost more than giving in and using Facebook’s paid ad platform.

Don’t let that get you down though. Organic reach and engagement may be nosediving, but there are still free ways you can boost your page’s engagement. Just ask a few members of the Young Entrepreneur Council. Or don’t, because 10 founders from YEC already shared their suggestions on Search Engine Journal.

We may eventually reach a point where organic reach is effectively dead on Facebook, but there are always tactics available to negate some of the drop in engagement and get the most possible out of the free side of the largest social media platform available.