Google has quietly revealed it will be discontinuing store visits reports from Google Analytics at the end of October.
While historical data will still be viewable on the reporting platform for the indefinite future, however, data will stop being generated by the end of the month.
The news was revealed in an update added without fanfare to the Google Analytics help page.
“On 10/31/2022, Store Visits reporting will be discontinued. As of this date, new Store Visits reporting will not be generated. Historical Store Visits reporting will remain available. Please reach out to your account manager if you have any questions.”
As the name suggests, Store Visits data estimates how many people have visited your physical store or business location after visiting its website.
This is done by correlating data saved from a user when they visit the website with data from phones with location history data if that device ever comes into close proximity to your store location.
This of course means the data does not track users who have location history disabled on their account.
Brands that rely on this data will be able to access it instead in Google Ads, where new data will continue to be gathered and reported. However, brands only have access to this feature if your Google Analytics account is linked to a Google Ads account.
Other than having to switch which platform you use to access your data, store visits reporting will be otherwise uninterrupted during this switchover.
https://www.tulsamarketingonline.com/wp-content/uploads/2022/10/STORE-VISITS-ANALYTICS.png400800Taylor Ballhttps://www.tulsamarketingonline.com/wp-content/uploads/2018/07/TMO-Logo.pngTaylor Ball2022-10-06 22:25:492022-10-06 22:25:51Store Visits Data is Leaving Google Analytics This Month
Facebook quietly revealed that it will be closing the Facebook Analytics service effective June 30th, 2021. After that date, brands and marketers will be unable to access their data. You can export your data to bring over to a new analytics service until then, though.
“Facebook Analytics will no longer be available after June 30, 2021. Until then, you will still be able to access reports, export charts and tables, and explore insights. To export data into a CSV file from Facebook Analytics on your desktop, click the arrow in the top-right corner of each chart or table.”
It is notable that the announcement did not explain the decision in any way. Instead, it simply pointed users to other tools which can replace some of the tracking and analytics features – though not all.
Among the recommended tools Facebook directed users to are:
Facebook Business Suite allows you to manage your Facebook and Instagram business accounts and can show you detailed insights about your audience, content and trends. (This tool may not be available to you yet.)
Ads Manager lets you view, make changes and see results for all your Facebook campaigns, ad sets and ads.
Events Manager can help you set up and manage Facebook Business Tools like the Facebook pixel and Conversions API, and reports actions taken on your website, in your app and in your physical store.
The quick shuttering of Facebook Analytics will make it more possible than ever to track users’ behavior on the platform. Even more frustrating for many, the primary recommended tool, Facebook Business Suite, is limited specifically to small businesses and is not actually available to the public yet. That means that there is less time to learn the more narrowly-focused tool during the transition period.
https://www.tulsamarketingonline.com/wp-content/uploads/2021/04/Goodbye-Facebook-Analytics.jpg360640Taylor Ballhttps://www.tulsamarketingonline.com/wp-content/uploads/2018/07/TMO-Logo.pngTaylor Ball2021-04-01 19:11:122021-04-01 19:11:14Facebook Suddenly Announces It Is Shutting Down Facebook Analytics
This week, Microsoft announced a free new analytics service called Clarity which aims to walk the line between in-depth insights and user privacy.
The set of tools is said to be completely GDPR compliant while still digging deep on a wide range of metrics that matter to businesses.
Doesn’t Slow Your Site Down
One of the biggest aspects of Microsoft Clarity is that it tracks an astonishing amount of non-identifiable data without measurably slowing your web site. Even more surprising is the lack of traffic caps – making Clarity an option even if you’re getting millions of visitors a day.
As the company says:
“Clarity is designed to have a very low impact on page load times, so you can make sure users navigating to your site won’t have to wait for pages to load.
Additionally, we don’t place any caps on your traffic so whether you get 10 visitors per day or 1,000,000, Clarity will be able to handle your traffic with no additional cost for you.”
Privacy Focused
Despite the amount of information gathered by Clarity, the analytics service still prioritizes privacy.
“We are GDPR compliant as a data controller for visitors to our site and processor for the data gathered by the Clarity script on your site.”
Session Playback
One of the three biggest features highlighted in Clarity is the ability to replay site visitors’ time on your site including where they moved their mouse, where they clicked, and what made them pause.
This is shown in a simple video recreating the visitor’s browser window with highlighted cursor movement.
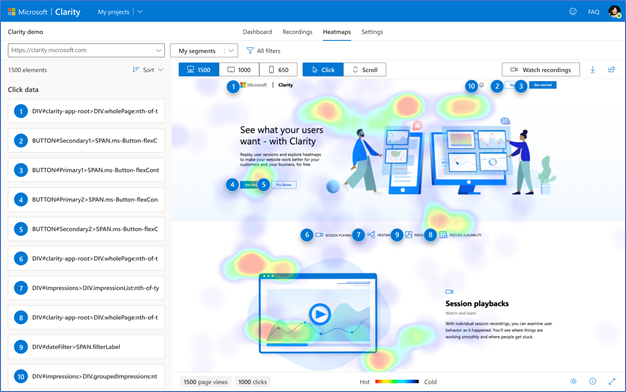
Heat Map
While session playbacks allow you to see what single visitors are doing on your site, Clarity’s heat maps will show you what everyone is doing on your site.
This feature shows what page elements are getting clicked the most and where users are spending the most time on a page.
This can provide great insights into what is catching people’s attention, and where you are starting to lose them.
Though not available at launch, the company says they will also feature an option for scrolling metrics in the future, helping understand how users are traveling through your content.
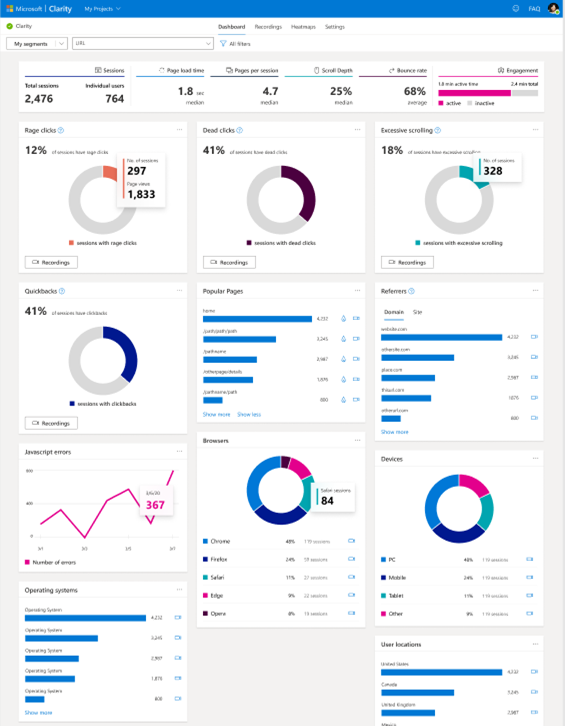
Insight Dashboard
To help break down and visualize all this information, Clarity includes a dashboard with a wide array of important metrics.
“We provide a dashboard of aggregate metrics to help you get an overall understanding of the traffic on your site. At a glance you will be able to see how many users were clicking on non-existent links or how many people scrolled up and down a page in search of something they couldn’t readily find.
You can also see things like how many concurrent JavaScript errors are occurring across your clients or how much time the average user spends navigating your site.”
To start using Clarity for yourself, sign up here.
YouTube is giving us all a glimpse into how the world responded to the COVID-19 pandemic with a new batch of data showing what we’ve been watching in 2020.
The insights reveal a wide-range of trends, but an overall theme of self-care and learning new skills runs throughout.
Let’s check out some of the most revealing details from the report:
Home Cooking
As restaurant shutdowns spread in March and remain at least partially in effect across the nation, many have had to brush up on their cooking abilities or expand their repertoire.
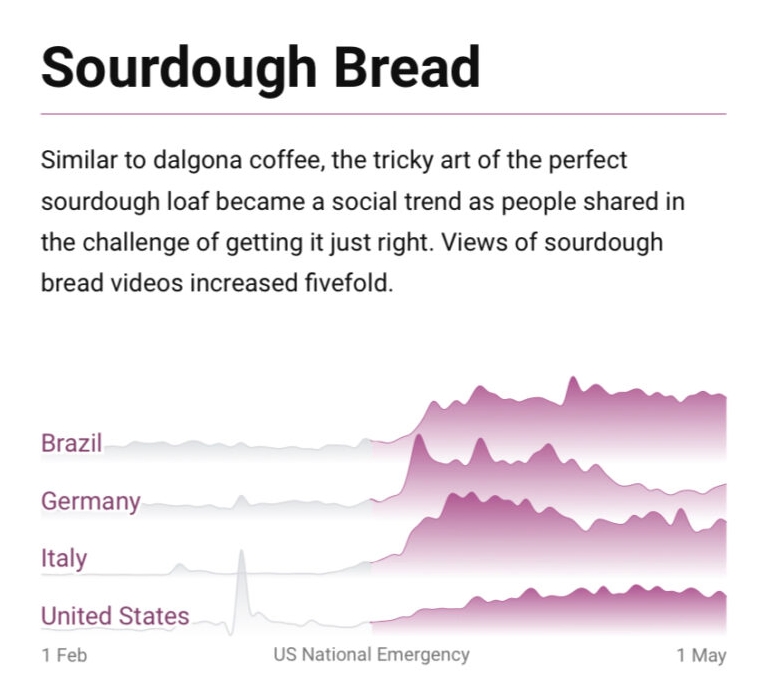
Add to this that the shutdowns gave many considerable extra time to try their hands at cooking things which take hours or even days to do properly, and you may start to understand why sourdough bread was a major trend on YouTube this year.
“By the end of March, one could make a legitimate case that a good portion of the world was simultaneously fixated on how to achieve a superlative sourdough starter. And the evidence for that was on YouTube.”
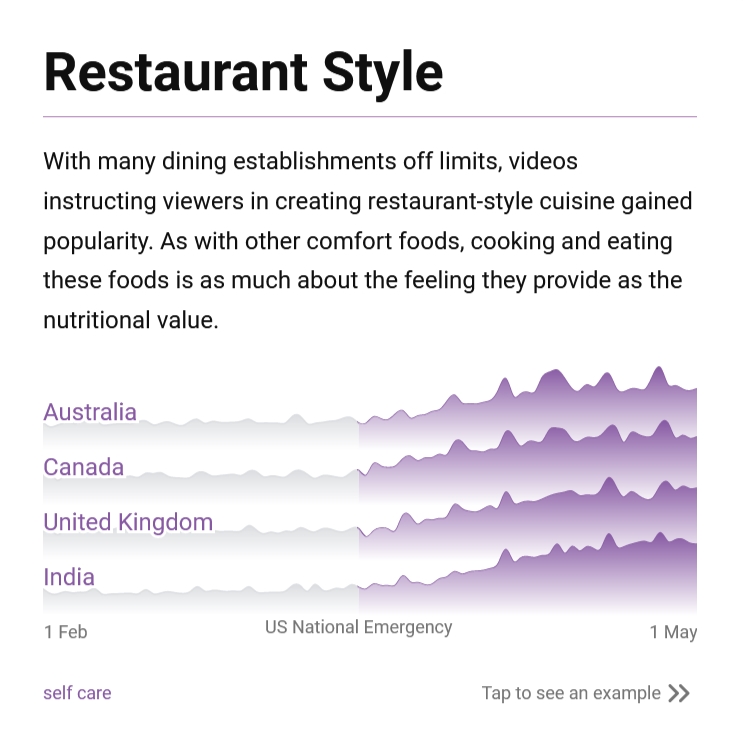
Similarly, users around the world increasingly searched for “restaurant-style” cooking techniques and recipes to replicate their favorite eateries from home.
The company notes that it is extremely rare for countries around the world to all be searching for similar topics at the same time. Still, once the pandemic began in earnest earlier this year, global searches for cooking tutorials have been consistently heightened no matter where you live.
Self-Care
This year has been uniquely turbulent, which has led many to use YouTube to assist in or to learn new techniques for coping with anxiety or stress.
Specifically, people have been watching countless videos related to food, exercise, relaxation, medication, and peaceful sleeping since March.
This includes heightened searches for a variety of topics including:
Yoga (Daily views have doubled since March)
Guided Meditation (Daily views increased 40% since March)
Home Workouts (Daily views increased 4x since March)
Nature Sounds
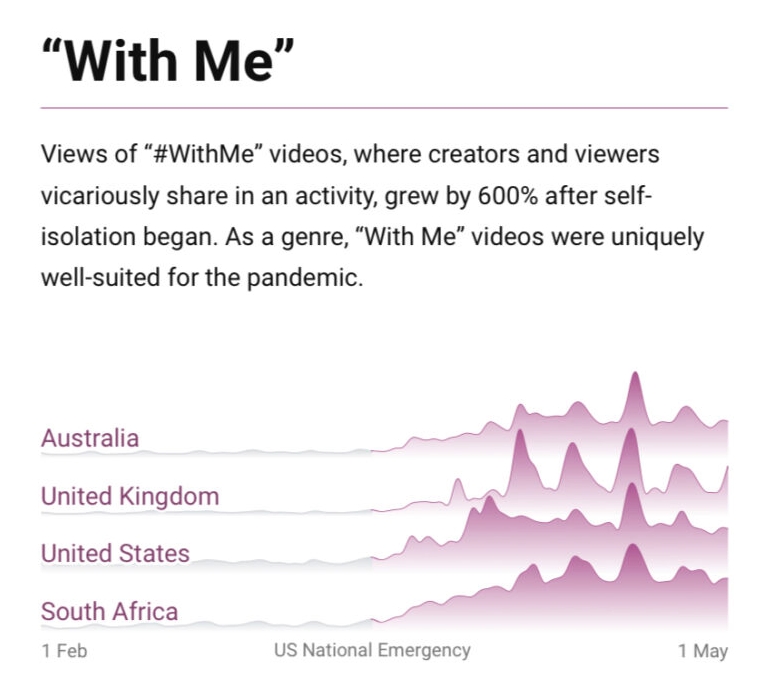
Keeping Close While Social Distancing
Perhaps the strongest way YouTube has helped people cope with the ongoing pandemic is by providing a way to stay connected.
“YouTube viewers used video to engage with each other directly and indirectly, sometimes in nuanced ways: even just participating in a rising coffee-making trend can make someone feel more connected to other people.”
This is most obvious when looking at the data for a few notable video trends:
‘With Me’ Videos (Views of #WithMe videos jumped 600% since March)
Museum Tours (Daily views up 60%)
Face Masks (DIY tutorials have been viewed over 400 million times)
Dalgona coffee (A briefly viral treat connected users around the world)
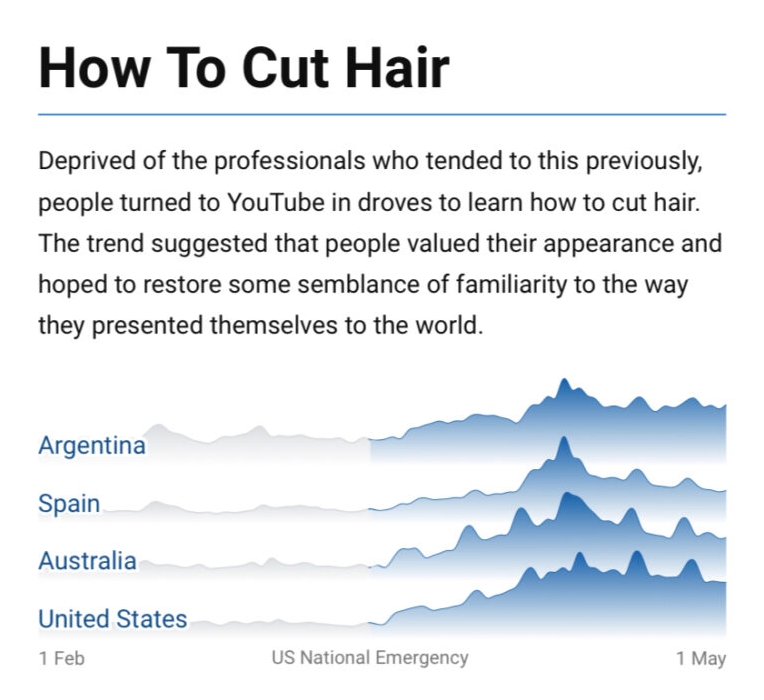
Building Your Identity
Without our usual ways to express ourselves, many saw YouTube as both a creative outlet and a learning tool for further developing their identity.
“Video proved to be a unique way people could both express who they were and who they might become — say, by learning a new skill.”
This is reflected in a variety of video topics which have trended up since March, including:
Gardening
How to cut hair
Religious services
Video call beauty tips
YouTube as a Mirror
This data shows that people around the world have turned to a few basic needs when it comes to their content right now. From India to the U.S., YouTube says the uniformity of these trends has been “astonishing”.
When it comes to what people are watching right now, it all boils down to three basic needs:
https://www.tulsamarketingonline.com/wp-content/uploads/2020/08/YouTubeTrendsBannerSmall.jpg360640Taylor Ballhttps://www.tulsamarketingonline.com/wp-content/uploads/2018/07/TMO-Logo.pngTaylor Ball2020-08-11 15:39:542020-08-11 15:39:56The Top YouTube Trends of The Year Reveal a Need For Connection
Bing has officially completed the launch of its new Bing Webmaster Tools, which streamlines the old tool suite while offering a number of new features.
According to the announcement, the process managed to condense the old version’s 47 unique links to just 17 different links without losing any of the functionality previously available. This was done by bundling redundant or related functions into more powerful tools.
At the same time, Bing announced it had introduced a new URL inspection tool, a Robots.txt testing feature, a site scan tool, and revamped webmaster guidelines.
However, the old version won’t be sticking around for too long. The announcement says it will be disabled sometime next month.
Enhanced Tools
While streamlining the platform, Bing expanded the functionality of several tools. These updates include:
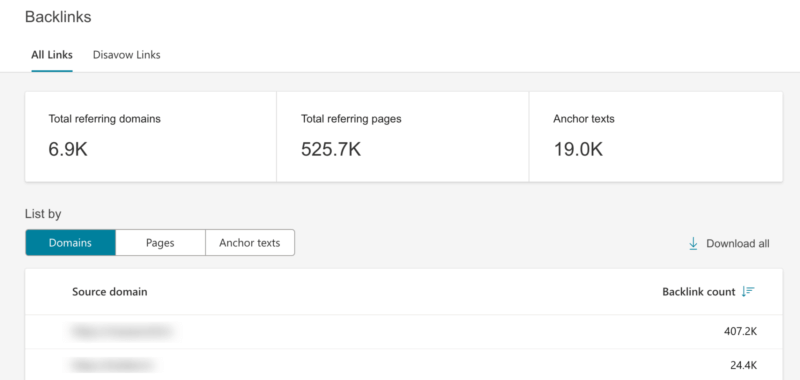
Backlinks lists backlinks for any site, including similar websites.
Keyword Research lets you filter data by countries, languages, and devices.
URL Submission is better streamlined for easier navigation. This includes simplifying URL submission via the Bing WordPress plugin for faster indexing.
SEO Reports provides improved classification of errors or issues.
New Tools
Along with the consolidated and enhanced tools from the old version of Bing Webmaster Tools, the company revealed several new tools. These include:
URL Inspection: A beta feature that allows Bing to inspect crawled versions of your site for potential indexing issues.
Site Scan: A site audit tool that crawls and checks your site for common SEO issues which may affect your search ranking.
Robots.txt Tester: Check your robots.txt file using the same inspection tools Bing uses to verify your URLs.
https://www.tulsamarketingonline.com/wp-content/uploads/2020/07/BingBanner640x.jpg360640Taylor Ballhttps://www.tulsamarketingonline.com/wp-content/uploads/2018/07/TMO-Logo.pngTaylor Ball2020-07-30 15:17:262020-07-30 15:17:28Introducing The New Bing Webmaster Tools
Bing revealed major overhauls to its Webmaster Tools suite this week. The new layout and features aim to make the tools available to SEOs and webmasters faster, easier to use, and more actionable.
As SMX West, the company said the first phase of the overhaul would be coming the first week of March, with a sleeker interface and three primary new features:
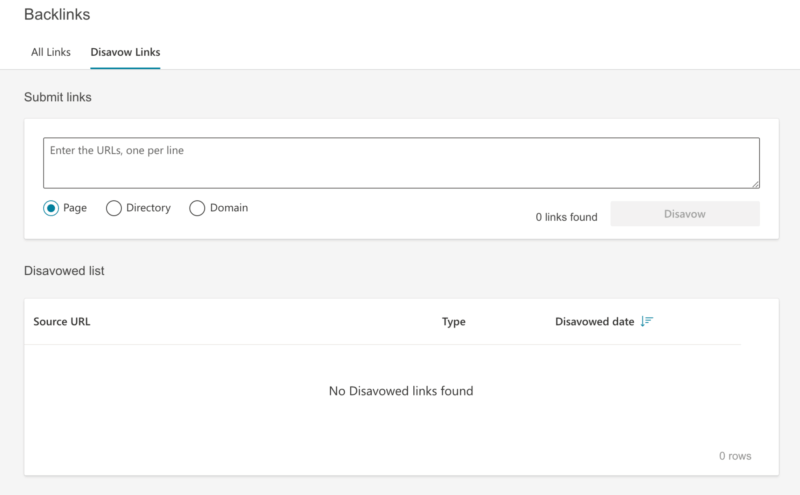
Backlinks Portal: The current inbound links report will be merged with a disavow links tool to become part of the backlinks report portal.
Search Performance: Similarly, the company is combining its page traffic and search keywords reports into a unified search performance report.
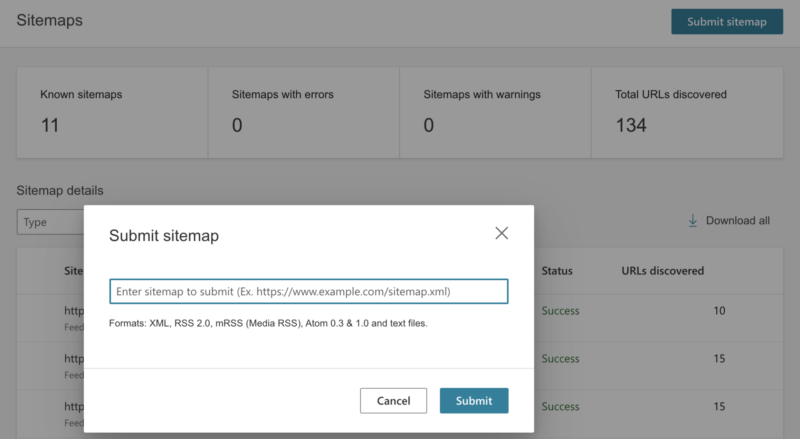
Sitemaps: Bing is giving its current sitemaps page a general overhaul to make it more valuable to online marketers and webmasters.
When It’s Coming
As the company said in its announcement:
“We are delighted to announce the first iteration of the refreshed Bing Webmaster Tools portal. We are releasing the new portal to a select set of users this week and will be rolling out to all users by the 1st week of March.”
What It Looks Like
Search Engine Land provided several screenshots of what the new portal will look like once it goes live:
Search Performance Report
Backlink Report
Disavow Link Tool
Sitemaps
Once they go live, anyone with a Bing Webmaster Tools account can access the new features by navigating to the Sitemaps, Inbound Links, Page Traffic, or Search Keywords reports.
Why It Matters
Despite being frequently overlooked by brands and marketers, Bing has been quietly cementing its grasp on a significant percentage of the search market. The new tools will make it easier for those taking advantage of this opportunity to better understand their website’s performance and refine their efforts for even better performance in the future.
Unless you are regularly keeping an eye on your site’s analytics, you might never know when you suddenly lose a ton of traffic or clicks. That is somewhat changing, however, as webmasters can now be notified to sudden drops in clicks through Google’s Search Console.
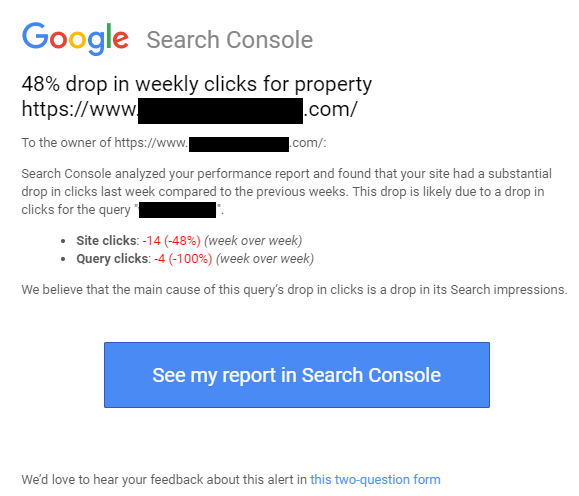
Search Console is now sending alerts to webmasters when it detects a “substantial drop” in clicks compared to your past week’s data.
Google is doing this by reviewing your week-over-week data in the Performance report for your site. If this week’s data is drastically different, it will send a notification to verified property owners in Search Console to alert them of the problem.
The new notification was first noticed by Vance Moore III who shared a screenshot of the notification on Twitter:
It is unclear exactly how large of a drop it takes to trigger the notification. In the case above, Moore experienced nearly a 50% drop in clicks.
Of course, the tool has some obvious limits. The first is that it only compares week-to-week data. That means slower downward trends will likely not trigger a notification. Additionally, the notification appears to only be triggered by clicks but does not account for traffic or bounce-rates.
The best course of action will always be to regularly check your analytics data to properly assess your site’s performance. There, you will find everything from your click performance, to conversions, traffic, and even demographic info about your visitors.
Still, it always helps to have an extra alert in place for when sudden changes happen to your site. That way you can respond to any new issues and quickly remedy any issues that could have led to your drop in clicks.
Analytics is an essential way to measure the effectiveness of your ads, but traditionally your results are kept in isolation. The only thing you have to compare against is past results.
Bing is changing that, with a new way to compare the results of your ad campaigns against how your competitors are performing.
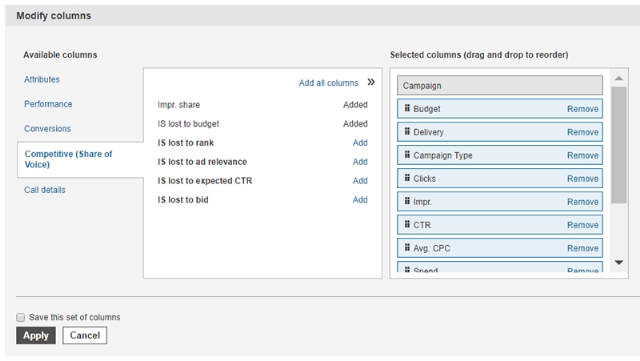
These new competitive metrics, also known as “share of voice” metrics, have been added to Bing’s in-line performance views, with details on your ads and similar campaigns in your industry. You still can’t hand-pick your local competitors and spy on their campaigns, but the new metrics will give you a better view of how you are doing within your market.
To get started, just log into your Bing Ads account and select either Accounts Summary, Campaigns, Ad Groups, or Keywords. Once you’re on any of these pages, click the Columns button. This will allow you to add any metrics from the Competitive (Share of Voice) section. Once you’ve applied your changes, these new metrics will appear in your reports.
Bing says the metrics are compatible with all other reporting features offered by the platform.
The announcement says this latest update is just “one of many” enhancements to Bing analytics the company will be releasing this year, though they are keeping those upcoming updates a secret for now.
00Taylor Ballhttps://www.tulsamarketingonline.com/wp-content/uploads/2018/07/TMO-Logo.pngTaylor Ball2017-06-28 13:55:442017-06-28 13:55:44Compare your ad results against your competition with Bing Competitive Metrics
Online marketing can be a scary world sometimes. You invest time and money on building up your brand and improving your online visibility, but it can all come crashing down overnight. It’s terrifying to think of, but it is the reality of the internet – everything is always changing.
While there is no 100% guaranteed way to protect your brand from this risk, you can take a few steps to help you sleep easier and feel assured you won’t wake up to a marketing nightmare. As long as you cover these bases, you’ll be safe from the most common disasters that befall brands online.
Don’t let your domain get snatched up
Website domains are kind of a funny thing. They are the foundation you build all your online marketing efforts on. But, once you have it set it is incredibly easy to forget. It’s one of those things that seems like it should last forever.
But, of course, that’s not the case. If you aren’t keeping an eye on things, it can be easy to one day wake up and discover your domain registration has expired. That alone can be enough to make for a stressful morning, but in some cases you may find you have lost your domain entirely.
Having your domain snatched up when it lapses is shockingly common and can happen to businesses of any size. Even huge brands and public figures like the Dallas Cowboys and Microsoft have dropped the ball and had to pay huge amounts to regain control of their domains.
Thankfully, most registrars now offer services to help you maintain control of your domain. Some allow for auto-renewal, while others offer text message warnings before your domain expires. In the case of GoDaddy, the service keeps your domain safe for almost 20 days after it expires so that you can get them back.
Watch your rankings (properly)
I know more than a few business owners who maintain the same ritual. Every few days, they will pull up the browser of choice and check their ranking for a few specific keywords. So long as they remain fairly high on the first page, they stay happy.
If that sounds like you, I have some bad news. The search results you see aren’t necessarily what others are seeing and you may have been sliding down the page for everyone else all this time.
Every major search engine does some form of customizing search results for individual users based on a variety of factors. This can include demographic data, location information, and search behaviors. So, if you’re regularly visiting your website or searching from inside the office, you’re pretty much guaranteed to be high-up when you search for your company.
Instead, get a real look at how you are performing by using an analytics service. There are a number of free services available, but I always recommend Google Analytics as a starting point. The learning curve can feel steep, but once you’ve got the hang of it, you can quickly find everything you want to know about your site’s performance.
Take control of your reputation
Stop me if you’ve heard this one before: A small business is gaining steam and popularity. Suddenly it all comes screeching to a halt, as your internet traffic dries up and your website stops converting. The culprit? A single bad review in the right place.
It is perhaps the scariest campfire story you can tell a business owner. Sites like Yelp have become notorious for destroying local businesses who handled a negative review the wrong way.
In some cases, the business owners just try to ignore the bad review while it festers and drives away any interested customers. Unfortunately, ignoring the problem doesn’t make it go away. In even worse situations, a business owner can let their emotions get to them and lash out at the reviewer – a move pretty much guaranteed to make you go viral for reasons you don’t want.
Neither of these is the right approach, and both can cause you headaches for a long time to come.
Thankfully, there is a right way to make sure your online reputation remains stellar no matter how scathing of a review you get from a disgruntled customer – address it head on every time. Rather than letting it get to you, keep an even head and treat every customer how you’d like to be treated. You’d be shocked to see just how many angry customers can be flipped into brand advocates so long as they feel their voice is heard.
The most important thing here is to be sure to watch all the major places people are likely to be talking about your business and be able to respond appropriately. This includes Yelp, Twitter, and Facebook. Check at least once a day to make sure you haven’t gotten any new reviews that need your attention. While you’re at it, it also never hurts to take the time to show your thanks to any positive reviews or mentions you’ve received as well.
Google Analytics is an essential tool for making sure your website is performing as you would like and making improvements to keep growing, whether you are a high-level marketer or a business owner who just launched their site.
If you aren’t familiar with Analytics, however, or the technical jargon that fills your reports, it can be difficult to make sense of the huge amount of information available. That can make it hard for someone new to running a website for their business to make sense of the huge amount of information available in Google Analytics.
Thankfully, you don’t have to depend on analysts, marketers, or your company’s “computer guy”, to understand how your site is performing with Google Analytics. Search Engine Watch has put together an easy-to-understand glossary for all the jargon and confusing labels that you will come across, making it simple for you to know exactly what your reports are saying about your site.
00Taylor Ballhttps://www.tulsamarketingonline.com/wp-content/uploads/2018/07/TMO-Logo.pngTaylor Ball2016-04-14 11:39:382016-04-14 11:39:38Learn The Language of Google Analytics With This Handy Guide