This week, Facebook introduced a new mobile ‘Ads Manager’ app which claims to make it easier for the over 800,000 monthly advertisers on the site to manage ads on the go.
The new Ads Manager app allows advertisers to create new ads, as well as tweak and monitor existing ads on the fly. It also includes budgeting and scheduling features.
This means increasing budgets for well-performing ads or drafting up new ads is as easy as pulling out your phone, no matter where you are.
The Ads Manager app is available now for American iOS users, and the company says Android users can expect the app later this year.
The timing of the new app is especially relevant as the company simultaneously announced reaching a milestone of two million unique businesses advertising on Facebook.
00Taylor Ballhttps://www.tulsamarketingonline.com/wp-content/uploads/2018/07/TMO-Logo.pngTaylor Ball2015-02-26 13:46:182015-02-26 13:46:18Facebook Ads Manager Lets You Control Your Ads On The Go
Facebook is usually rather tight lipped about how it measures the impact and views for ads on their site, but today the social media giant offered some rare insight by saying the company doesn’t believe advertisers should be charged unless ads are seen by real people.
This might seem like common sense, but it is actually common for online advertising services to measure impressions based on how many ads are ‘served’, not how many are ‘viewed’.
Ads are counted as being ‘served’ so long as the ad renders anywhere on pages that are opened, even if the ad ends up never actually appearing on the screen. On the other hand, ‘viewed’ impressions only counts if they are displayed on the screen.
The metric isn’t perfect. There is no fool-proof way to ensure someone scrolling down a page will actually glance at an ad, as most Facebook users can tell you. Still, Facebook’s method of measuring impressions seems to be a more accurate and fair way of counting ad views than is typically used.
Facebook explains why it counts viewed vs served ad impressions in their blog post on the subject:
“At Facebook, we agree that viewed impressions are a better way to measure ad delivery. The reason is simple: if an ad is viewed it has a greater chance to drive value for an advertiser. That’s why we use viewed impressions to measure ad delivery across desktop and mobile.”
The company hopes to expand this measuring method to organic posts on the site in the next few months.
00Taylor Ballhttps://www.tulsamarketingonline.com/wp-content/uploads/2018/07/TMO-Logo.pngTaylor Ball2015-02-19 12:41:392015-02-19 12:41:39Facebook Says It Doesn’t Charge For Ads Unless They Are Seen
Twitter likes to tout itself as the social media site to watch events unfold as they happen, but a recent online survey suggests the majority of people will be sticking with Facebook during the Super Bowl this weekend.
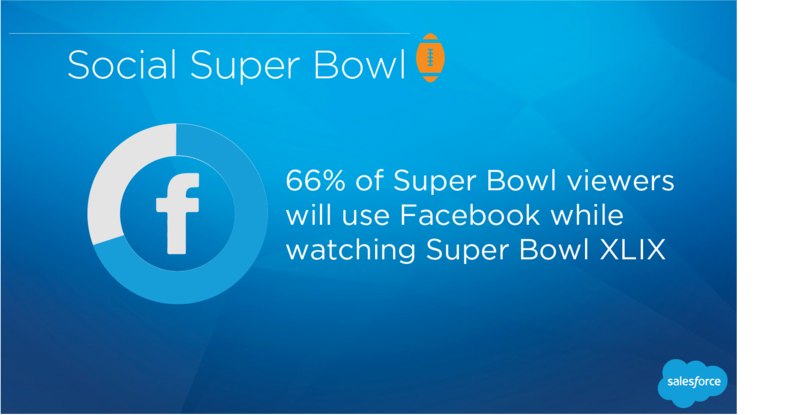
According to the results of a survey by Salesforce Marketing Cloud, 66% of respondents plan to use Facebook while they watch the game, compared to just 56% who said they plan on using Twitter. Instagram came in third with 31% and Snapchat followed with just 11%.
Marketing Cloud’s survey received more than 400 responses over the past week, which means the survey is far from scientific. Nonetheless, the results do provide some insight into viewer behavior on social media during the big game.
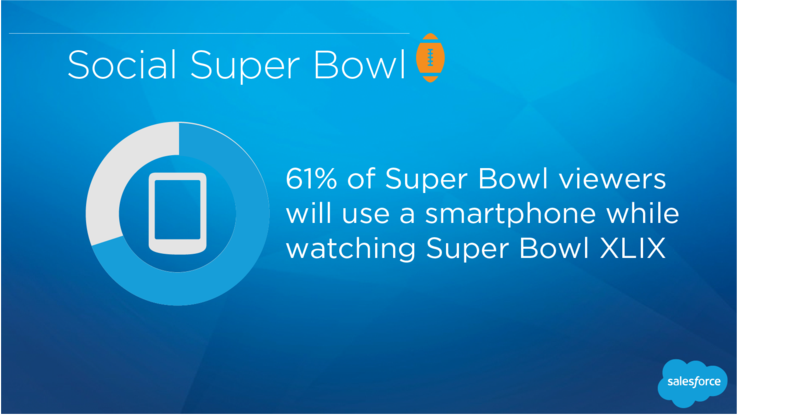
The findings also showed that over 60% of Super Bowl viewers will be watching with a smartphone in hand, 24% will have a tablet, and 20% plan to watch with their laptop.
The results also provide some demographic information. Unsurprisingly, younger users leaned towards newer social media channels such as Snapchat, which will be used by approximately 45% of people between the ages of 12 and 24. However, Facebook and Twitter still led the poll within the demographic. Over 80% of 18-24 year olds will be Tweeting during the game, while 66% plan on posting to Facebook.
It is also not surprising to find Facebook had the biggest pull with older viewers. Over 75% aged 35-44 say they will use Facebook, compared to 54% who will use Twitter. This trend continues in the 45054 demographic, with 71% planning to use Facebook and 54% planning to use Twitter.
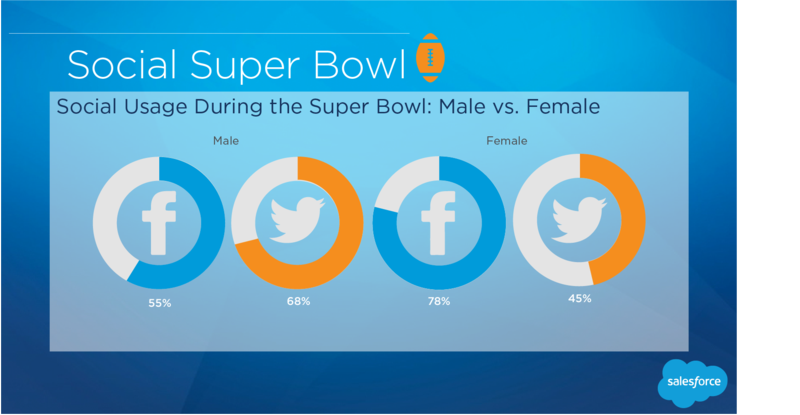
Perhaps the biggest shock in the results is the distribution of gender amongst social media platforms. Facebook overwhelmingly draws in female users, with 78% planning to post during the game. In comparison, only 45% of women plan to use Twitter. The results were distinctly reversed for men, 68% of whom will be Tweeting, compared to 55% for Facebook.
00Taylor Ballhttps://www.tulsamarketingonline.com/wp-content/uploads/2018/07/TMO-Logo.pngTaylor Ball2015-01-30 12:14:202015-01-30 12:14:20Survey Shows Facebook Is The Favorite For Super Bowl Sunday
Facebook has always made it easy to see how your ads are performing in terms of clicks and views, but gauging actual sales from ads hasn’t been so easy. Now, a mew metric called ‘conversion lift measurement’, Facebook claims they can accurately measure the amount of business attributed to ads.
Here’s how conversion lift is measured:
When a Facebook campaign begins, two groups are created. One is a random test group of people that see the ads in the campaign, and the other is a control group of people that don’t see the ads.
Advertisers share conversion data with Facebook throughout the campaign. Facebook determines additional lift generated from the campaign by comparing conversions in the test and control groups.
Any increase in sales in the test group is the result of a ‘conversion lift’ provided by the Facebook ads.
The best part of online advertisement is being able to track nearly every aspect of your advertisement’s performance, but there are still gaps where marketers have had to rely on faith and intuition. Thanks to conversion lift measurement, there’s now one less blind spot.
00Taylor Ballhttps://www.tulsamarketingonline.com/wp-content/uploads/2018/07/TMO-Logo.pngTaylor Ball2015-01-28 12:31:002015-01-28 12:31:00Facebook Makes It Easier To See If Your Ads Are Driving Sales
Over the past year, more than a few people have predicted the death of Facebook. They cite the shrinking number of teens signing up for the social site and the increasing difficulty for brands to get organic exposure as proof the end is near. But, a new report from Shareaholic show Facebook is still going strong.
Facebook has consistently been the leader in social referral traffic for years, and their share of traffic referrals is only growing especially during the last quarter of 2014. In fact, Shareaholic’s data suggests Facebook may be responsible for nearly a quarter of all traffic online.
The most popular social media site reached over 25% of the total share of visits to Shareaholic’s network through October and December, however it fell to 24.64% in December. Overall the site gained 2.27 percent since the third quarter.
The report confirms Pinterest’s popularity, as the data showed the site in second place. Still, even Pinterest can’t compete with Facebook’s share of traffic referrals. Pinterest’s share was only 5.06%, nearly five times less than Facebook.
00Taylor Ballhttps://www.tulsamarketingonline.com/wp-content/uploads/2018/07/TMO-Logo.pngTaylor Ball2015-01-26 13:08:562015-01-26 13:08:56Facebook Continues to Lead Social Traffic Referrals
The Super Bowl is quite possibly the biggest single day for advertisers. There aren’t many other times you’ll hear anyone proclaim they are watching something “just for the commercials.” But, it has always been difficult for online marketers to get into the mix. That all might be changing as Facebook has announced a new tool to help online advertisers target people interested in the “Big Game.”
The “Big Game” targeting segment allows advertisers to reach people specifically based on real-time online discussions related to the Super Bowl.
According to the announcement, the segment will go much further than simply targeting football fans. The “Big Game” segment will also include those liking, commenting, and sharing content related to party planning, recipes, or even flatscreen TV purchases in the days leading up to XLIX.
The targeting tool is also designed to be updated frequently, so that ads will be directed based on up-to-date information.
The new tool is a change of strategy for Facebook, who used interests and liked pages to target ads last year.
According to the social media platform, combining ads with live sporting events is a highly effective strategy for reaching specific targeted demographics. For example, it cites a cross-platform Nielsen study that analyzed at a Microsoft commercial that was shown during the 2014 Super Bowl and found Microsoft was able to reach 35% of persons 18 to 49 in the United States during a four-day run of the TV spot.
Using Facebook ads during this campaign allowed Microsoft to extend that reach to 57% of the national target of people 18-49. Among the younger 21 to 24-year-old audience, Microsoft more than doubled its reach, extending its TV reach of 24% to a combined TV-plus-Facebook reach of 53%.3.
The new targeting segment is available starting today for all advertisers. It can be found in the Facebook ads interface within the “Behaviors” section, under the “Seasonal and Events” category.
00Taylor Ballhttps://www.tulsamarketingonline.com/wp-content/uploads/2018/07/TMO-Logo.pngTaylor Ball2015-01-22 12:41:542015-01-22 12:41:54New Facebook Tool Helps You Target Your Ads For Super Bowl XLIX
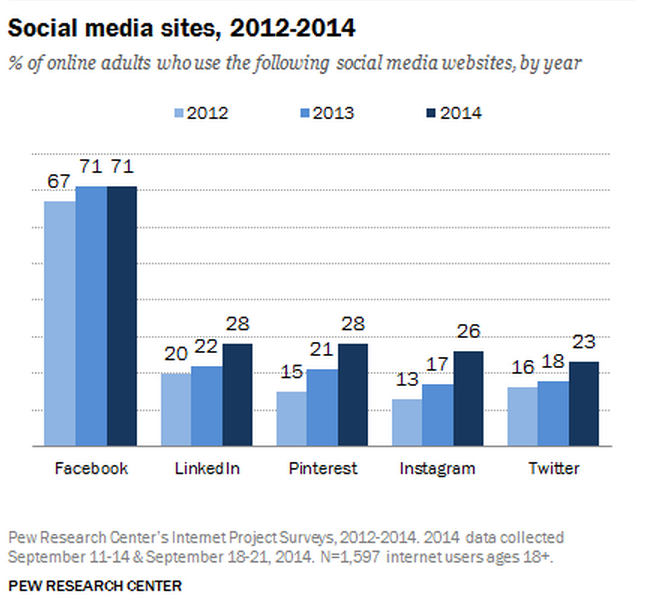
Facebook may still be the most popular social media site, but Instagram is easily the fastest growing site, according to a new survey released by Pew Research Internet Project.
The survey shows the most popular social media site’s growth may be stagnating, but their most recent changes seem to be improving engagement.
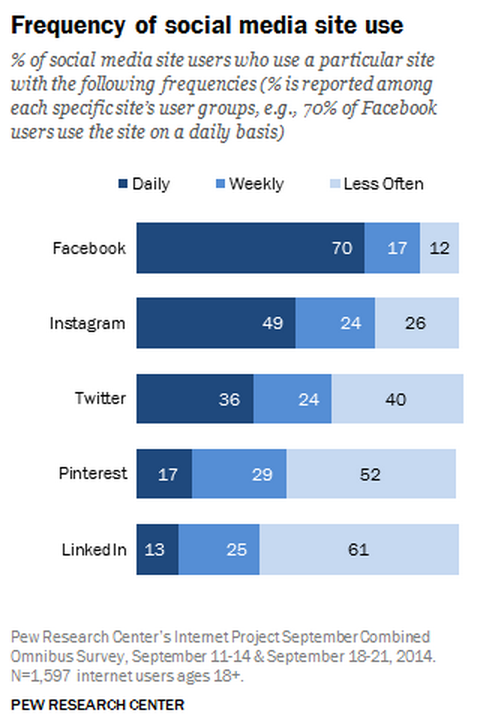
The Pew numbers suggest Facebook facilitates the most engagement of any social platform, as 70% of users fully engage with the site daily. That’s a notable increase from 63% last year. In comparison, only 49 percent of Instagram users and 17 percent of Pinterest users engage with the sites on a daily basis.
While Instagram is unable to draw the engagement levels of Facebook, they outpace anyone in the market when it comes to attracting new users. Over the past year, the number of American adults using Instagram rose 9 percent. That means 26 percent of all adults in the U.S. now use the site.
In comparison to, Pinterest only grew 7 percent, LinkedIn grew by 6 percent, and Twitter grew by 5 percent. Instagram’s huge rise shouldn’t be too surprising, as they recently announced reaching 300 million monthly active users, surpassing Twitter for the first time.
Daily use of Twitter dropped 10 percentage points to 36%. Twenty-two percent say they check the site several times a day, 24% a few times a week and 40% less often.
Instagram showed statistically significant growth across all age demographics, while still skewing younger. Notably 53% of younger adults (18-29) use the service, up from 37% in 2013. Instagram users are very active; 49% say they use the site daily, 32% several times a day and 24% weekly.
Pinterest is still favored mostly by women, with 42% of all online U.S. females saying they are Pinterest users. That’s up from 33% the year before. Men, on the other hand, are still lagging at 13%, an increase of 5 points over 2013.
LinkedIn users are coming to the site less often with weekly users dropping to 25% from 34% and those who visit every few weeks or less increasing to 61% from 52% the previous year. Users of the career-oriented network still skew older, higher income and college educated (50% of college graduates — an increase of 12 percentage points from 2013 — use LinkedIn).
00Taylor Ballhttps://www.tulsamarketingonline.com/wp-content/uploads/2018/07/TMO-Logo.pngTaylor Ball2015-01-12 14:47:562015-01-12 14:47:56Pew Survey Shows Facebook Is Still The Most Popular Social Media Site
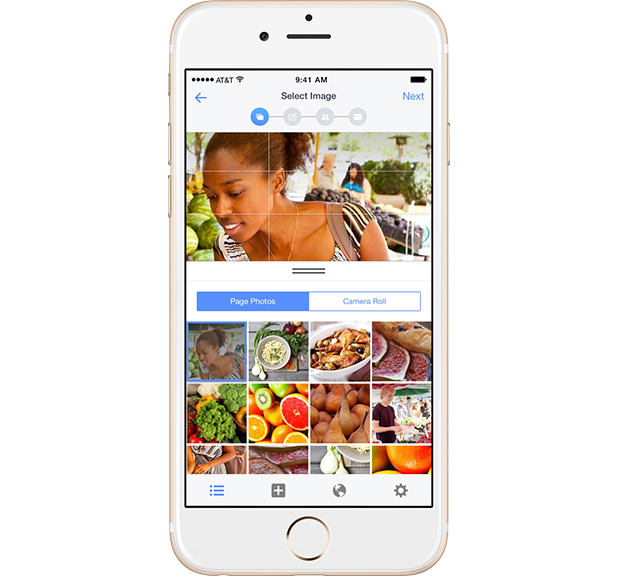
Expect to see a lot more videos in your Facebook feed. According to the social media platform, people around the world are posting 75% more videos to Facebook compared to this time last year, and that growth is even greater in the U.S. where video uploads on the social network have risen 94%.
Unsurprisingly, this surplus of video content has also led to a much greater amount of videos being featured in users’ news feeds. Facebook says the number of videos featured in news feeds has risen 360% over the past year.
“With people creating, posting and interacting with more videos on Facebook, the composition of News Feed is changing,” said Facebook in the announcement. “Globally, the amount of video from people and brands in News Feed has increased 3.6x year-over-year.”
“Since June 2014, Facebook has averaged more than 1 billion video views every day. On average, more than 50% of people who come back to Facebook every day in the US watch at least one video daily and 76% of people in the US who use Facebook say they tend to discover the videos they watch on Facebook.”
With the fast growth, Facebook is poised to overtake YouTube as the primary place for marketers to post videos, especially as previous studies have found that on desktop Facebook has already surpassed YouTube in monthly video views.
Facebook also included suggestions for video creators to ensure you get the most reach possible for videos on the platform:
As a creator, you should be conscious that people will discover your video in News Feed next to a photo from a friend or a status update from a relative. Your video needs to fit in, and it needs to be something that your audience will want to watch and share.
With the launch of auto-play and the surge in mobile use, it’s also important to focus on posting videos that grab people from the first frame of video. Shorter, timely video content tends to do well in News Feed. Keep in mind that auto-play videos play silently in News Feed until someone taps to hear sound, so videos that catch people’s attention even without sound often find success.
00Taylor Ballhttps://www.tulsamarketingonline.com/wp-content/uploads/2018/07/TMO-Logo.pngTaylor Ball2015-01-08 14:37:022015-01-08 14:37:02Facebook Highlights Huge Increase In Video Uploads and Views
As the year comes to a close, countless companies are releasing their 2014 recaps and best-of-lists, including Facebook and Twitter who have both recently released their year in review which highlights the top trends, topics, locations, and content across social media his year.
Facebook
Here are the top updates, trends and locations on Facebook in 2014:
Top Global Topics
World Cup
Ebola virus outbreak
Elections in Brazil
Robin Williams
Ice Bucket Challenge
Conflict in Gaza
Malaysia Airlines
Super Bowl
Michael Brown/Ferguson
Sochi Winter Olympics
Most Talked About US Topics
Ebola virus outbreak
Ice Bucket Challenge
Robin Williams
Super Bowl
Michael Brown/Ferguson
World Cup
Conflict in Gaza
US midterm elections
Malaysia Airlines
ISIS
Most Checked-Into US Locations
Disney properties
Universal Studios Hollywood
Times Square
Yosemite National Park
Grand Canyon National Park
Yellowstone National Park
Yankee Stadium
Las Vegas Strip
Hollywood Walk of Fame
Madison Square Garden
Twitter
Using the site 2014.twitter.com, Twitter has released their top moments and perspectives of 2014 that can be juxtaposed with previous years. Here are some highlights:
00Taylor Ballhttps://www.tulsamarketingonline.com/wp-content/uploads/2018/07/TMO-Logo.pngTaylor Ball2014-12-15 12:27:292014-12-15 12:27:29Facebook and Twitter Release Their 2014 “Year In Review” Lists
Facebook has been rolling out tons of new features aimed at improving business pages lately, but the most recent feature could be the most important of them all. Yesterday, the social media site announced it would be launching call-to-action buttons visible on business pages.
As the announcement explains:
“Pages are an important destination for people on Facebook, and we’re building new ways for people to interact with businesses through them. Today, we’re announcing a new call-to-action feature that will help Pages drive business objectives.”
This new feature allows users to more quickly make the action they are most likely to be looking for, and you can more efficiently direct visitors on your page to your most valuable destination. Whether you want users to sign up for your mailing list, browse your e-commerce store, or book a reservation, there’s a button to fit your needs.
Matt Southern broke down the 7 call-to-action button options announced so far, along with briefly explaining what each is likely to be used for. Facebook’s announcement did not go into details beyond the names of the buttons, but you can get an idea what to expect below:
Book Now: To direct visitors to book a table at your restaurant or, a room in a hotel, or a similar kind of reservation.
Contact Us: You can likely use this to direct visitors to a contact form, or if you’re brave perhaps it could be a button to email you directly.
Use App: If your company has its own app this could be a button to open the app on your mobile device.
Play Game: If you’re a mobile app development company this could be a link to play your latest game.
Shop Now: Direct visitors to your e-commerce store.
Sign Up: Direct visitors to your mailing list sign up page, or a webinar sign up page, or something like that.
Watch Video: Pretty self-explanatory, direct visitors to watch a video of your choice.
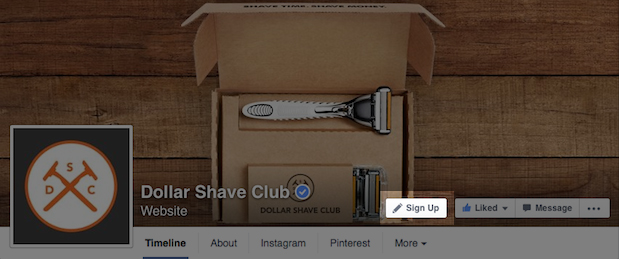
For an example of how these buttons will work, you can see the business page for Dollar Shave Club, who has had access to these call-to-action buttons already. Apparently it is working well for them:
“Over the course of a three-week test, the Sign Up call-to-action button delivered a 2.5x higher conversion rate versus other comparable social placements aimed to drive new user acquisition.”
These buttons will roll out in the US over the next few weeks and worldwide next year.
 Facebook is making it a lot easier to measure the amount of new business you get from ads on the social media site,
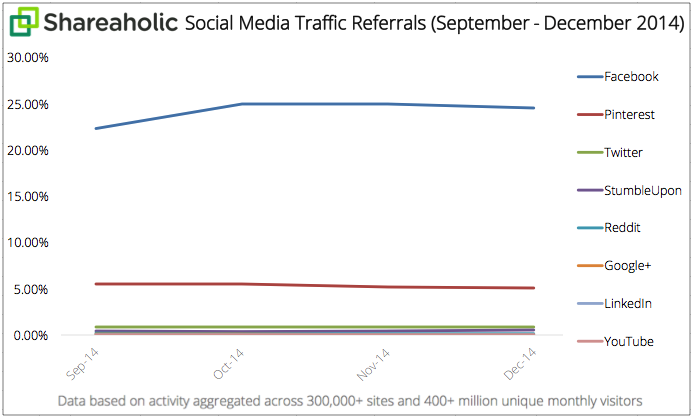
 The Super Bowl is quite possibly the biggest single day for advertisers. There aren’t many other times you’ll hear anyone proclaim they are watching something “just for the commercials.” But, it has always been difficult for online marketers to get into the mix. That all might be changing as Facebook has announced a new tool to help online advertisers target people interested in the “Big Game.”