Google Analytics 4 is rolling out a new report that will help businesses identify their most engaged and profitable audiences.
The new report was revealed in a Google Analytics support page detailing its features.
So long as you’ve had at least one user in a specified time period, the report will provide details that make it easier to define who your most effective audience is. With this information, brands can then make more informed decisions about their marketing to improve future performance.
Specifically, the new Audiences report will include six important metrics:
Active users
Average session duration
New users
Sessions
Views per session
Total revenue
To view details about any audience in the report, click the name of the audience and a tab containing more in-depth information will open.‘
These details are available to all sites using Google Analytics, though they may need to be added by an administrator.
To view the report, users can sign into their GA4 account, select the ‘Reports’ button on the left-hand menu, and click the tab ‘User’.From there, look for ‘User Attributes’ and click ‘Audiences’.
https://www.tulsamarketingonline.com/wp-content/uploads/2023/08/Audience-Analytics.png34566912Taylor Ballhttps://www.tulsamarketingonline.com/wp-content/uploads/2018/07/TMO-Logo.pngTaylor Ball2023-08-01 18:37:592023-08-01 18:38:01New Google Analytics 4 Report Identifies Your Most Engaged and Profitable Audiences
Google has quietly revealed it will be discontinuing store visits reports from Google Analytics at the end of October.
While historical data will still be viewable on the reporting platform for the indefinite future, however, data will stop being generated by the end of the month.
The news was revealed in an update added without fanfare to the Google Analytics help page.
“On 10/31/2022, Store Visits reporting will be discontinued. As of this date, new Store Visits reporting will not be generated. Historical Store Visits reporting will remain available. Please reach out to your account manager if you have any questions.”
As the name suggests, Store Visits data estimates how many people have visited your physical store or business location after visiting its website.
This is done by correlating data saved from a user when they visit the website with data from phones with location history data if that device ever comes into close proximity to your store location.
This of course means the data does not track users who have location history disabled on their account.
Brands that rely on this data will be able to access it instead in Google Ads, where new data will continue to be gathered and reported. However, brands only have access to this feature if your Google Analytics account is linked to a Google Ads account.
Other than having to switch which platform you use to access your data, store visits reporting will be otherwise uninterrupted during this switchover.
https://www.tulsamarketingonline.com/wp-content/uploads/2022/10/STORE-VISITS-ANALYTICS.png400800Taylor Ballhttps://www.tulsamarketingonline.com/wp-content/uploads/2018/07/TMO-Logo.pngTaylor Ball2022-10-06 22:25:492022-10-06 22:25:51Store Visits Data is Leaving Google Analytics This Month
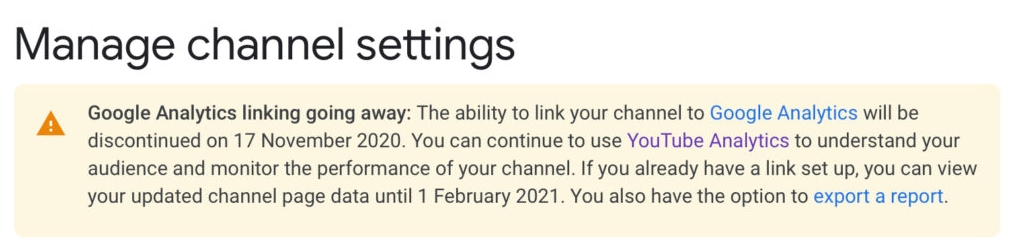
According to an update on the YouTube Help page, Google Analytics has stopped collecting new data from YouTube channels beginning February 1st.
While older data is still available, any new information will be available solely through YouTube Studio.
The change doesn’t come as a particularly big surprise. Users lost the ability to link Google Analytics and YouTube pages in November of last year. However, connected channels were able to keep tracking data from YouTube until now.
Most likely already rely on YouTube Analytics for monitoring their channel performance, as it has always offered significantly more information compared to what could be found in Google Analytics. The ability to track major YouTube metrics through Google’s tool set was more about conveniently checking both platforms at the same time.
Still, those affected received little warning about the change. The only information relating to the decision was buried in a YouTube Help page.
What You Should Know About YouTube Analytics
While YouTube Analytics offers all the information you have come to expect from Google Analytics (and more), there are a couple key differences.
Most importantly, you don’t have to add any tracking code, pixels, or anything else to get your data. YouTube collects information about engagement, views, and more for your channel and videos automatically.
You will also find more granular information, with everything from specific audience details for every video on your channel, revenue information, and search terms used to find your channel.
All of this is collected within five main tabs:
Overview: This section collects essential broad metrics for your channel, like watch time, total views, and subscribers. Here you will find reports addressing top videos, realtime activity, latest videos, and average performance.
Reach: The ‘Reach’ tab shows your overall connection with YouTube users with data on impressions and clicks. Users can get reports for traffic source types, top external sources, impressions, and search terms in this section.
Engagement: Now, we start moving deeper to exactly what your viewers are watching on your channel as shown by total watch minutes. Read reports for top videos and playlists, top cards, and end screens here.
Audience: Explore who your viewers are with data on unique viewers, average videos watched per viewer, and overall subscriber growth. Reports included here cover audience location, demographics, and other channels they interact with.
Revenue: If you are a member of the YouTube Partner Program, you will also find this tab that addresses how much money is being generated through monetized videos.
For a brief guide on YouTube Studio Analytics, watch the video from the YouTube Creators channel below:
https://www.tulsamarketingonline.com/wp-content/uploads/2020/07/YouTube-Search.jpg10022240Taylor Ballhttps://www.tulsamarketingonline.com/wp-content/uploads/2018/07/TMO-Logo.pngTaylor Ball2021-02-04 17:56:442021-02-04 17:56:46Your YouTube Data Is No Longer Available On Google Analytics
When it comes to marketing your business, it’s all about image. How people perceive your business will decide whether they decide to come in the door or walk away. This is especially true online.
One of the first images people will see when they find your business is almost always your photos in your local listings on search engines. Thankfully, Google has given you more control and more data on how your images are performing.
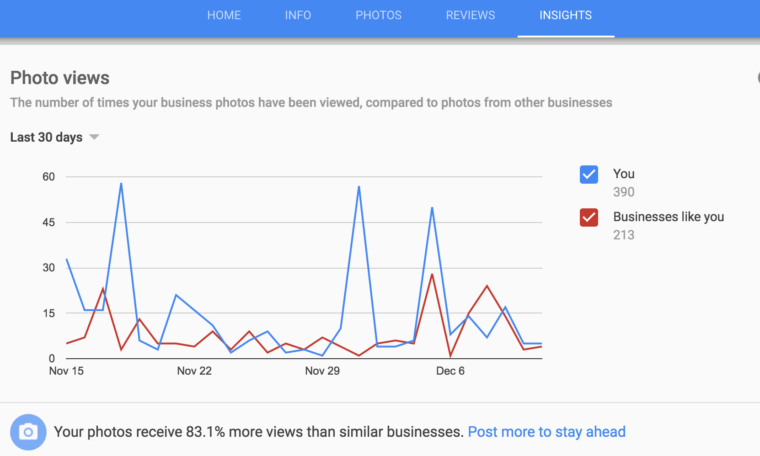
With the new insights for photos on business listings, you can see how people are responding to your listing and images and compare them against your competition.
You can easily see the new insights in your Google My Business listing by clicking the Insights tab on the top navigation bar. At the bottom of the screen, you’ll find a graph comparing your business to “businesses like you”.
You can refine the time-period you want to look at by the past 90 days, past 30 days, and past 7 days.
Unfortunately, you can’t select exactly what businesses you are comparing your site against, nor do you even get to know who the “businesses like you” are. But, the new tool can still be an effective way to make sure you are making a great first impression with your listings on Google.
00Taylor Ballhttps://www.tulsamarketingonline.com/wp-content/uploads/2018/07/TMO-Logo.pngTaylor Ball2016-12-19 15:35:012016-12-19 15:35:01New Google Tool Helps You Make The Best First Impression
Google Analytics is an essential tool for making sure your website is performing as you would like and making improvements to keep growing, whether you are a high-level marketer or a business owner who just launched their site.
If you aren’t familiar with Analytics, however, or the technical jargon that fills your reports, it can be difficult to make sense of the huge amount of information available. That can make it hard for someone new to running a website for their business to make sense of the huge amount of information available in Google Analytics.
Thankfully, you don’t have to depend on analysts, marketers, or your company’s “computer guy”, to understand how your site is performing with Google Analytics. Search Engine Watch has put together an easy-to-understand glossary for all the jargon and confusing labels that you will come across, making it simple for you to know exactly what your reports are saying about your site.
00Taylor Ballhttps://www.tulsamarketingonline.com/wp-content/uploads/2018/07/TMO-Logo.pngTaylor Ball2016-04-14 11:39:382016-04-14 11:39:38Learn The Language of Google Analytics With This Handy Guide
Google Analytics is an essential tool for webmasters and marketers looking to take control of their marketing efforts and increase both revenue and engagement. Now, Google is taking the platform even further with the introduction of the new enterprise-oriented measurement platform, Google Analytics 360 Suite.
In an announcement posted this week on the blog Inside Adwords, Vice President of Analytics, Display, and Video Products Paul Muret said:
“Sophisticated marketers who use analytics platforms are 3X more likely to outperform their peers in achieving revenue goals. It’s no wonder enterprise-class marketers have been telling us they need more from their marketing analytics tools. Many toolsets can’t cope: They’re too hard to use, lack sufficient collaboration capabilities, are poorly integrated, and require hard to find expertise.”
Muret also told Marketing Land that marketers are “trying to engage with brief moments of engagement” referring to so-called micro-moments. “If the value is not delivered” within the brief window of time, “consumers will quickly move on.”
The new platform is intended to deliver an enterprise-oriented analytics service that is both comprehensive and easy-to-use while focusing in on those brief moments of engagement and opportunity.
Google has remained mum on if there are any new data sources feeding into the Suite, and cross-device tracking remains the same. Rather, Google Analytics 360 Suite is intended to expand upon Google Analytics Premium, its previous enterprise-oriented analytics platform.
The suite includes four new tools, as well as two old mainstays:
Google Audience Center 360 (beta). This powerful data management platform (DMP) helps marketers understand their customers and find more like them across channels, devices, and campaigns. It offers native integration with Google and DoubleClick, plus it’s open to third-party data providers, DSPs and more.
Google Optimize 360 (beta). This website testing and personalization product helps marketers deliver better experiences. Marketers can show consumers multiple variations of their site and then choose the version that works best for each audience.
Google Data Studio 360 (beta). A new data analysis and visualization product that integrates data across all suite products and other data sources ― turning it into beautiful, interactive reports and dashboards. Built-in real-time collaboration and sharing is based on Google Docs technology.
Google Tag Manager 360. Built from our industry-leading tag management product, it empowers enterprise marketers to move faster and make decisions with confidence. It offers a simplified way to gather site information (all those tiny bits of code) and powerful APIs to increase data accuracy and streamline workflows.
Google Analytics 360, formerly known as GA Premium, will roll out exciting new capabilities throughout the next couple of months as investments continue to grow. It will serve as the measurement centerpiece by analyzing customer data from all touch-points and integrating with our ad products to drive marketing effectiveness.
Google Attribution 360, formerly known as Adometry, has been rebuilt from the ground up to help advertisers value marketing investments and allocate budgets with confidence. Marketers can analyze performance across all channels, devices, and systems to achieve their most effective marketing mix.
All these tools are available on the dashboard, and Google has said the platform also includes a broad set of integrated third-party providers, such as customer relationship management platforms.
The individual products will be offered à la carte, under to-be-announced pricing. Google Analytics Premium and Adometry will be relaunched under the Google Analytics 360 Suite platform “in the coming months.” Google Analytics Premium and Adometry customers will also be offered access to the new tools in a limited beta test in the future.
00Taylor Ballhttps://www.tulsamarketingonline.com/wp-content/uploads/2018/07/TMO-Logo.pngTaylor Ball2016-03-17 11:39:122016-03-17 11:39:12Google Announces Google Analytics 360 Suite
Most online advertisers consider conversion tracking an essential part of their toolkit. After all, why pour money into advertising if you can’t properly see how effective it is and optimize it? However, there are many businesses who are not using conversion tracking or importing goals from Google Analytics into AdWords. Google says they have a new feature just for them.
The new Smart Goals are powered by Google Analytics and aim to help businesses without a way to measure conversions evaluate their advertising efforts and optimize their campaigns.
Unlike conversion tracking and Analytics goals, Smart Goals don’t measure actions taken directly on an advertiser’s website. Instead, it uses the anonymized conversion data collected from other websites by Google Analytics to identify visits “most likely” to convert based on Google’s estimate.
To generate Smart Goals, we apply machine learning across thousands of websites that use Google Analytics and have opted in to share anonymized conversion data. From this information, we can distill dozens of key factors that correlate with likelihood to convert: things like session duration, pages per session, location, device and browser. We can then apply these key factors to any website. The easiest way to think about Smart Goals is that they reflect your website visits that our model indicates are most likely to lead to conversions.
To set up Smart Goals, advertisers will need to link their Analytics and AdWords accounts and must receive at least 1,000 clicks rom AdWords over a 30-day period “to ensure the validity of your data.” From there, select Smart Goals, under Goals in the Admin tab.
Advertisers can even preview well Smart Goals can work for their site before activating it by exploring the new “Smart Goals” page under Conversions in Analytics. This page lets you analyze the behavior of Smart Goals visits and compare those to the visits deemed unlikely to convert. If you like what you are seeing, you can then import Smart Goals into AdWords.
Once Smart Goals have been imported, advertisers can set a target cost per acquisition (CPA) with the Smart Goals being the acquisition. The announcement says, “in this way, you’re able to optimize your AdWords spend based on the likelihood of conversion as determined by our model.”
Google says Smart Goals will be rolling out over the next few weeks. While it may serve as a reasonable solution for some businesses, for most Smart Goals may seem like a bit of a stop-gap solution. To really take control of your online advertising and guarantee you are getting your money’s worth, you will want to use conversion tracking,
If you need help getting started, contact us. We can get you set up and help you optimize your advertising to ensure the best results.
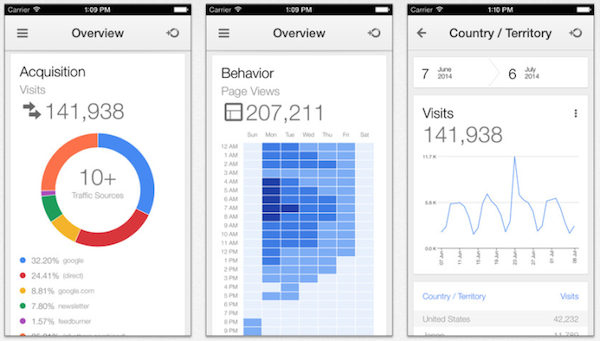
It’s been a long time coming, but starting yesterday you can download the official Google Analytics app for iPhone and iPod Touch. The Android version of the app has been available for quite a while, but naturally there was a delay before Google pushed it out to Apple devices.
While the app can run on the majority of Apple mobile devices, it is optimized for the iPhone 5 and requires a device running iOS 6.0 or later.
There aren’t a bunch of new features, but the app opens the opportunity for webmasters to keep up to date with Analytics on the go. You’ll find features such as sources, page views, visits, and TechCrunch says users will even have access to Real Time reports, which will allow you to monitor data as it occurs.
00Taylor Ballhttps://www.tulsamarketingonline.com/wp-content/uploads/2018/07/TMO-Logo.pngTaylor Ball2014-07-18 14:23:582014-07-18 14:23:58Google Analytics Comes to iOS
Google Analytics is easily one of the most trusted analytics platforms out there, but new findings are suggesting it may not be as accurate as once thought. Most recently, Groupon published a study which indicates that as much as 60% of what Google Analytics calls “direct traffic” is actually from organic search.
The study was conducted by Groupon’s Director of Product Management, who manages their organic search. While not entirely scientific, his study involved completely deindexing Groupon from Google for 6 hours.
Deindexing means absolutely no traffic would be coming from Google for the duration of the study, which allowed the study to calculate roughly what percent of traffic is coming from organic search.
During the six hours the site was deindexed, Groupon’s direct visits dropped by 60%, which led Groupon to believe that 60% of what is called direct traffic is actually coming from organic search traffic.
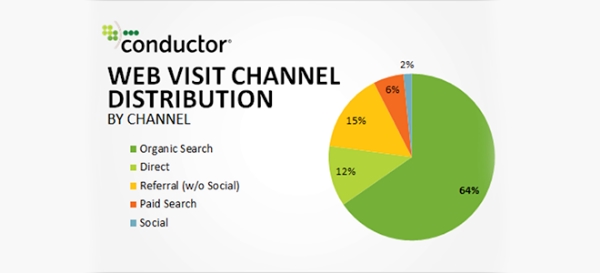
Groupon isn’t the only site to conduct a study like this. Not long ago, Conductor, a well-respected internet marketing firm, released a similar study which led them to the conclusion that 47% of traffic came from organic search. Nearly a third of that was attributed to direct visits.
Conductor Corroborates Groupon’s Findings
After Groupon released their findings, Conductor decided to revisit their initial study to see what would happen to the results if included the conclusions from Groupon’s study into their own data.
By taking 60% of visits originally attributed to ‘direct’ and reallocating them to ‘organic search’, organic search went from 47% of all visits to 64%. Direct visits dropped from 29% of visits to 12%. This significant discrepancy—17% separates the ‘before’ and ‘after’ allocations should be enough to give marketers pause—and question the assumptions on which their digital strategy lies.
While none of this means you should give up on Google Analytics (it is the best insight you have to website performance and how Google views your site), it does suggest that it is entirely possible that a much larger percentage of traffic is coming from organic search than previously thought.
00Taylor Ballhttps://www.tulsamarketingonline.com/wp-content/uploads/2018/07/TMO-Logo.pngTaylor Ball2014-07-16 12:19:542014-07-16 12:19:54Recent Studies Suggest Organic Search Is Responsible For More Traffic Than Previously Thought
Analytics is one of the most ignored aspects of web marketing, despite the fact that everyone is concerned with their site’s statistics. Tons of SEOs check their statistics even daily, but almost everyone relies on either a set of analytics tools or the generic settings in Google Analytics rather than looking deeper, and using more focused methods like Custom Reporting.
Relying on the generic settings in Google Analytics has two downsides. One, obviously, is the lack of focus and clarity that comes with not personally directing what statistics you are watching, and how you are gathering that data. The other is that Google Analytics changes just as often as every other part of Google, and if you aren’t holding the reins, your results will probably shift, making your data inaccurate.
If you want to take on custom reporting for your analytics, you will have a better idea of how you are performing, and what aspects of your site need work. Greg Habermann suggests starting your custom reports by looking at five recent changes to Google Analytics that you can take advantage of. All you have to do is take the initiative.
00TMOhttps://www.tulsamarketingonline.com/wp-content/uploads/2018/07/TMO-Logo.pngTMO2013-03-14 10:43:492013-03-14 10:43:49Take Charge of Your Analytics