Tag Archive for: Facebook

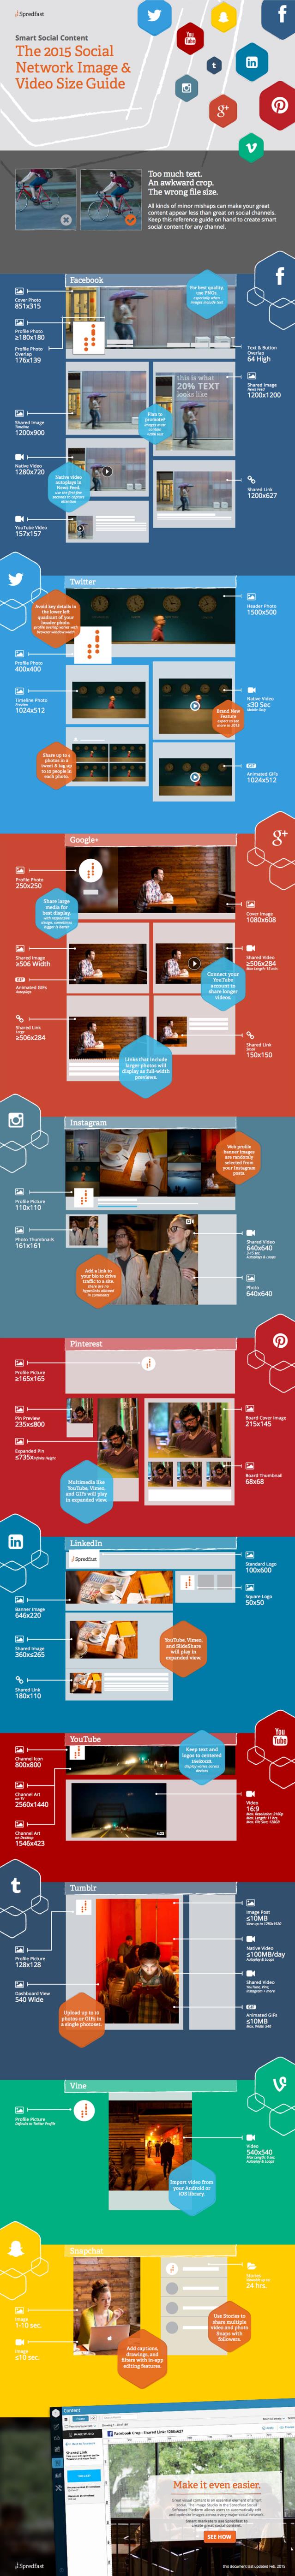
Social media is all about crafting an image and that starts at the profile and cover photos. These pictures are the first things visitors see when they come to your profile, and it is essential to maintain a consistent image across social media. Unfortunately, trying to prepare your photos in the ideal sizes and specifications for the wide array of social media platforms can be a headache.

Every single social media site has their own specific sizes for images and many of the specs can seem almost random. Facebook requires 851px by 315px, while Google calls for 1080px by 608px and images on LinkedIn are supposed to be 646px by 220px. You can spend your time trying to come up with a mnemonic device to try to keep all the different image specs straight, but chances are your time is better spent elsewhere.

Thankfully, the team at Spredfast created a handy infographic which lays out the most recent photo specs for pretty much any social network you are likely to be on. The graphic details all the ideal photo sizes for profile pics and cover photos, as well as detailing the optimal sizes for posting photos to make sure cropping won’t ruin the image.

 Social Image Size Infographic

This week, Facebook introduced a new mobile ‘Ads Manager’ app which claims to make it easier for the over 800,000 monthly advertisers on the site to manage ads on the go.

Facebook Ads Manager

The new Ads Manager app allows advertisers to create new ads, as well as tweak and monitor existing ads on the fly. It also includes budgeting and scheduling features.

This means increasing budgets for well-performing ads or drafting up new ads is as easy as pulling out your phone, no matter where you are.

The Ads Manager app is available now for American iOS users, and the company says Android users can expect the app later this year.

The timing of the new app is especially relevant as the company simultaneously announced reaching a milestone of two million unique businesses advertising on Facebook.

facebookadvertising

Facebook is usually rather tight lipped about how it measures the impact and views for ads on their site, but today the social media giant offered some rare insight by saying the company doesn’t believe advertisers should be charged unless ads are seen by real people.

This might seem like common sense, but it is actually common for online advertising services to measure impressions based on how many ads are ‘served’, not how many are ‘viewed’.

Ads are counted as being ‘served’ so long as the ad renders anywhere on pages that are opened, even if the ad ends up never actually appearing on the screen. On the other hand, ‘viewed’ impressions only counts if they are displayed on the screen.

The metric isn’t perfect. There is no fool-proof way to ensure someone scrolling down a page will actually glance at an ad, as most Facebook users can tell you. Still, Facebook’s method of measuring impressions seems to be a more accurate and fair way of counting ad views than is typically used.

Facebook explains why it counts viewed vs served ad impressions in their blog post on the subject:

“At Facebook, we agree that viewed impressions are a better way to measure ad delivery. The reason is simple: if an ad is viewed it has a greater chance to drive value for an advertiser. That’s why we use viewed impressions to measure ad delivery across desktop and mobile.”

The company hopes to expand this measuring method to organic posts on the site in the next few months.

Over the past year, more than a few people have predicted the death of Facebook. They cite the shrinking number of teens signing up for the social site and the increasing difficulty for brands to get organic exposure as proof the end is near. But, a new report from Shareaholic show Facebook is still going strong.

Facebook has consistently been the leader in social referral traffic for years, and their share of traffic referrals is only growing especially during the last quarter of 2014. In fact, Shareaholic’s data suggests Facebook may be responsible for nearly a quarter of all traffic online.

Social-Media-Traffic-Referrals-Report-Q4-2014-graph

The most popular social media site reached over 25% of the total share of visits to Shareaholic’s network through October and December, however it fell to 24.64% in December. Overall the site gained 2.27 percent since the third quarter.

The report confirms Pinterest’s popularity, as the data showed the site in second place. Still, even Pinterest can’t compete with Facebook’s share of traffic referrals. Pinterest’s share was only 5.06%, nearly five times less than Facebook.

Facebook may still be the most popular social media site, but Instagram is easily the fastest growing site, according to a new survey released by Pew Research Internet Project.

The survey shows the most popular social media site’s growth may be stagnating, but their most recent changes seem to be improving engagement.

pew-social-20141

The Pew numbers suggest Facebook facilitates the most engagement of any social platform, as 70% of users fully engage with the site daily. That’s a notable increase from 63% last year. In comparison, only 49 percent of Instagram users and 17 percent of Pinterest users engage with the sites on a daily basis.

While Instagram is unable to draw the engagement levels of Facebook, they outpace anyone in the market when it comes to attracting new users. Over the past year, the number of American adults using Instagram rose 9 percent. That means 26 percent of all adults in the U.S. now use the site.

pew-social-frequency-2014

In comparison to, Pinterest only grew 7 percent, LinkedIn grew by 6 percent, and Twitter grew by 5 percent. Instagram’s huge rise shouldn’t be too surprising, as they recently announced reaching 300 million monthly active users, surpassing Twitter for the first time.

Some other interesting findings in the report:

  • Daily use of Twitter dropped 10 percentage points to 36%. Twenty-two percent say they check the site several times a day, 24% a few times a week and 40% less often.
  • Instagram showed statistically significant growth across all age demographics, while still skewing younger. Notably 53% of younger adults (18-29) use the service, up from 37% in 2013. Instagram users are very active; 49% say they use the site daily, 32% several times a day and 24% weekly.
  • Pinterest is still favored mostly by women, with 42% of all online U.S. females saying they are Pinterest users. That’s up from 33% the year before. Men, on the other hand, are still lagging at 13%, an increase of 5 points over 2013.
  • LinkedIn users are coming to the site less often with weekly users dropping to 25% from 34% and those who visit every few weeks or less increasing to 61% from 52% the previous year. Users of the career-oriented network still skew older, higher income and college educated (50% of college graduates — an increase of 12 percentage points from 2013 — use LinkedIn).

As the year comes to a close, countless companies are releasing their 2014 recaps and best-of-lists, including Facebook and Twitter who have both recently released their year in review which highlights the top trends, topics, locations, and content across social media his year.

 Facebook

Facebook Banner

Here are the top updates, trends and locations on Facebook in 2014:

Top Global Topics

  1. World Cup
  2. Ebola virus outbreak
  3. Elections in Brazil
  4. Robin Williams
  5. Ice Bucket Challenge
  6. Conflict in Gaza
  7. Malaysia Airlines
  8. Super Bowl
  9. Michael Brown/Ferguson
  10. Sochi Winter Olympics

Most Talked About US Topics

  1. Ebola virus outbreak
  2. Ice Bucket Challenge
  3. Robin Williams
  4. Super Bowl
  5. Michael Brown/Ferguson
  6. World Cup
  7. Conflict in Gaza
  8. US midterm elections
  9. Malaysia Airlines
  10. ISIS

Most Checked-Into US Locations

  1. Disney properties
  2. Universal Studios Hollywood
  3. Times Square
  4. Yosemite National Park
  5. Grand Canyon National Park
  6. Yellowstone National Park
  7. Yankee Stadium
  8. Las Vegas Strip
  9. Hollywood Walk of Fame
  10. Madison Square Garden

Twitter

Twitter Banner

Using the site 2014.twitter.com, Twitter has released their top moments and perspectives of 2014 that can be juxtaposed with previous years. Here are some highlights:

The Golden Tweet (Most Retweeted)

Most Talked About Global Moments

  • World Cup
  • #BringBackOurGirls (Nigeria kidnapping hashtag)
  • #IndyRef (Scottish referendum on UK Independence hashtag)
  • Hong Kong Protests
  • #BlackLivesMatter (Social support against Ferguson decision hashtag)

Most Noteworthy Tweets of 2014

Twitter also shared a collection of the most noteworthy Tweets of 2014. That featured the following content from brands/organizations:

Facebook CTA

Facebook has been rolling out tons of new features aimed at improving business pages lately, but the most recent feature could be the most important of them all. Yesterday, the social media site announced it would be launching call-to-action buttons visible on business pages.

As the announcement explains:

“Pages are an important destination for people on Facebook, and we’re building new ways for people to interact with businesses through them. Today, we’re announcing a new call-to-action feature that will help Pages drive business objectives.”

This new feature allows users to more quickly make the action they are most likely to be looking for, and you can more efficiently direct visitors on your page to your most valuable destination. Whether you want users to sign up for your mailing list, browse your e-commerce store, or book a reservation, there’s a button to fit your needs.

Matt Southern broke down the 7 call-to-action button options announced so far, along with briefly explaining what each is likely to be used for. Facebook’s announcement did not go into details beyond the names of the buttons, but you can get an idea what to expect below:

  • Book Now: To direct visitors to book a table at your restaurant or, a room in a hotel, or a similar kind of reservation.
  • Contact Us: You can likely use this to direct visitors to a contact form, or if you’re brave perhaps it could be a button to email you directly.
  • Use App: If your company has its own app this could be a button to open the app on your mobile device.
  • Play Game: If you’re a mobile app development company this could be a link to play your latest game.
  • Shop Now: Direct visitors to your e-commerce store.
  • Sign Up: Direct visitors to your mailing list sign up page, or a webinar sign up page, or something like that.
  • Watch Video: Pretty self-explanatory, direct visitors to watch a video of your choice.

For an example of how these buttons will work, you can see the business page for Dollar Shave Club, who has had access to these call-to-action buttons already. Apparently it is working well for them:

“Over the course of a three-week test, the Sign Up call-to-action button delivered a 2.5x higher conversion rate versus other comparable social placements aimed to drive new user acquisition.”

These buttons will roll out in the US over the next few weeks and worldwide next year.

According to Parse.ly’s quarterly Authority Report, Facebook is still the best social platform for publishers looking for exposure. The site saw a 10 percent increase in referral traffic to publisher sites this August, compared to the data from a year earlier.

Parse.ly analyzed data from over 10 billion page views and more than 100,000 posts across its network to track online reading trends in an effort to determine peak reading times and referral traffic patterns. The report found that reading times peaked at 12:18 p.m., at which point desktop page views outperform mobile.

Pars.ly-referral-sites-list

While Google was still the lead referral traffic, Facebook continues to hold the second spot making it the top social network to send traffic to publisher websites.

Pars.ly-referral-sites

Surprisingly, the report shows very little change in traffic patterns over the past year, with Facebook being the only site in the top 10 to experience a significant increase in the amount of traffic sent to publisher sites.

Pars.ly-referral-categories-800x355

Parse.ly’s report also noted that traffic from social sites had risen seven percent over the past year, while traffic from search sites fell by four percent. You can get more insights from the downloadable report here.

like-gate
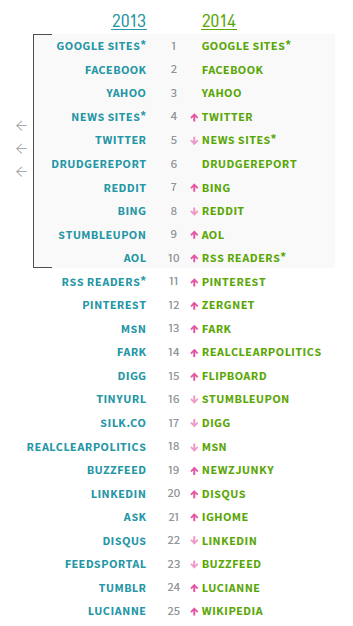
Tomorrow marks a rather significant change in Facebook policy as they close the so-called “like gate.” As announced in August, Facebook has decided that pages will no longer be able to require likes to enter contests or view content.

Facebook said the change was intended to guarantee people are only using likes on pages they really want to engage with, not due to “artificial incentives.” Interestingly, this is also one of the few changes Facebook has made recently to receive widespread praise.

Most social media and marketing professionals agree like gates were far from the best means of achieving the desired result, often drawing in many who have no real interest in a business. Emeric Ernoult, CEO of AgoraPulse, gave the example of pages which used giveaways of iPads or other popular consumer goods to inflate likes.

“It was too easy to make mistakes,” Ernoult told Marketing Land. “There have been too many people doing things that were actually hurting them but they didn’t realize it.”

Most importantly, the rule change doesn’t ban pages from simply asking for likes, which Ernoult agrees is an overall better policy. “You are asking now, you are proposing. You’re not forcing and that’s a big difference,” he said. “And I think it will force page owners and marketers to think about how sexy they could be and how appealing they could be. Instead of, ‘Of well, they’ll have to become fans anyway so we don’t have to explain.'”