Google Adds Time Aggregation to AdWords
Jon Diorio and the Google+ account for Google Ads announced today that a new feature is available in Adwords that will allow you to get a better look at your data. It is a small addition, but many advertisers will find it very useful.
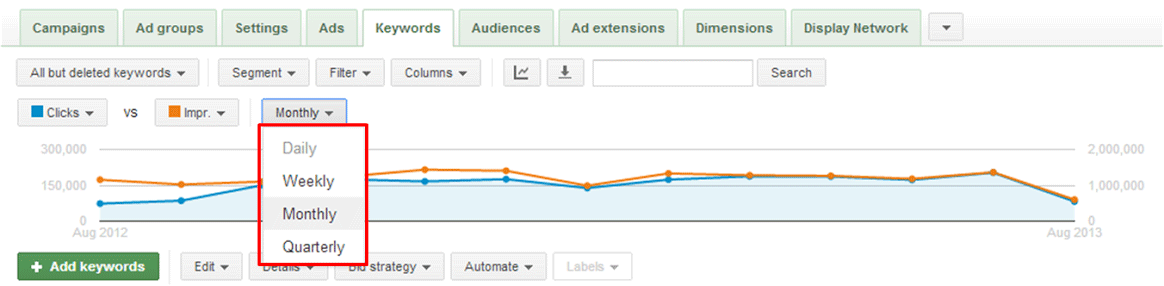
Beginning today, you can control the time aggregation on Adwords charts to show data down to a day-by-day view. You can also view it by week, month, or quarter. This way, you can see the big and small pictures with just a couple clicks, and keep track of the smaller level trends.
The announcement read:
Today, we’re making it easier and faster to get a customized view of how your performance is trending with a new button right above your chart in AdWords that lets you toggle between Daily, Weekly, Monthly, or Quarterly data (shown below). We hope this will save you time and make you more efficient while optimizing your search campaigns.


Leave a Reply
Want to join the discussion?Feel free to contribute!