Google My Business is expanding its performance report for business listings with a new breakdown of how people are finding your listing.

The new analytics section details whether people are coming to your listing using either a mobile or desktop device, as well as if they found you through Google Search or Maps.

How To Find The New Report

To access the report for your listing, first sign in and select which location or business you are wanting to assess. Then, select the Insights tab on the left. On this page, you’ll find the new performance reports available directly at the top.

Below, you can see an example of the report shared by Barry Schwartz from Search Engine Roundtable.

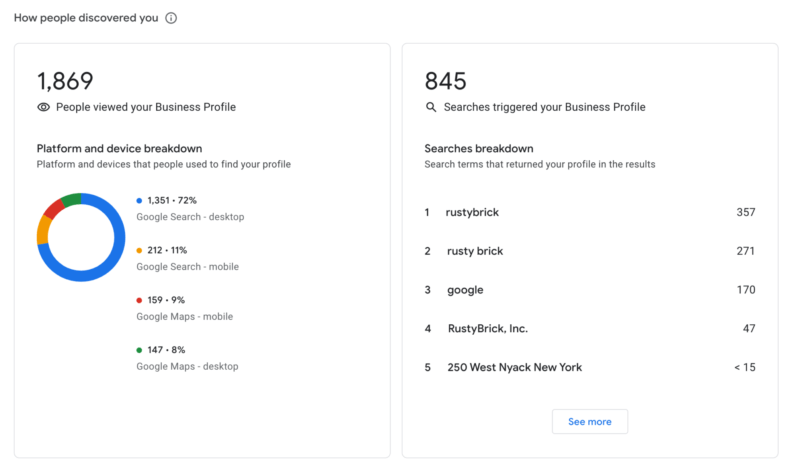
Within the performance report, you’ll find a section explaining “How people discovered you.”

On one side of the report, you’ll see the “People who viewed your business profile” section, while the right column shows the specific searches being used to find your page.

Learning More About Device and Source Reports

To coincide with the launch of these reports, Google has updated its help documents to add a section explaining the “users who viewed your profile” data.

As the document explains:

“A user can be counted a limited number of times if they visit your Business Profile on multiple devices and platforms such as desktop or mobile and Google Maps or Google Search. Per breakdown device and platform, a user can only be counted once a day. Multiple daily visits aren’t counted. “

There are also a few important details to keep in mind when viewing the report:

  • Since this metric represents the number of unique users, it may be lower than the number of views you find on Google My Business and in email notifications. 
  • Since the metric focuses on views of the Business Profile, as opposed to overall views of the Business on Google, it may also be lower than the number of views you find on Google My Business and in email notifications.

Insights like these help with not only improving your listings and optimization to perform more effectively in search results. They can also help understand your customers and their specific needs or behaviors which may, in turn, allow you to provide better service for them.

After months of rumors, Twitter has confirmed it is launching a subscription-like feature which allows users to pay for premium content from content creators or influencers on the platform.

The company previewed the new feature it is calling “Super Follow” at its investor-focused Analyst Day event last week, along with a few other new features which are coming to the platform soon.

What Is Twitter’s “Super Follow”?

Super Follow will soon allow creators, influencers, and brands to monetize their tweets, similar to platforms like Patreon or YouTube Subscriptions.

“Twitter is working on a “Super Follow” function that can be used to earn money directly on the platform. Here are the first screenshots”

For a monthly fee, Twitter users can sign up to get exclusive content and perks from a select creator, including:

  • A supporter badge
  • Access to a subscriber-only newsletter
  • Exclusive content
  • Exclusive promotions and discounts
  • VIP community access

Unlike what you can find on sites like Patreon, Super Follow is a one-size-fits-all feature amd does not allow for separate tiers for fans or support.

While the specific revenue split is not clear, Twitter says creators will be able to earn money directly through Super Follow, making this a viable way to increase revenue from social media. This will likely also make Super Follow an attractive option for publishers hoping to find a new source of revenue other than digital advertising placements on their site.

Twitter Communities Take On Facebook Groups

Another upcoming feature highlighted at the Analyst Day event was the launch of Twitter Communities.

Similar to Facebook Groups, Communities allows users to join together around common interests or topics.

Details about the feature are hard to come by, but images shared by those who attended the event show a conversation hub which may make discussions easier for larger communities. 

Otherwise, the layout, design, and features look distinctly familiar to anyone who has been active on Facebook Groups in the past few years.

Twitter’s Goals for 2021 and Beyond

To close out the presentation, Twitter listed three specific goals to achieve in the future:

  • Double development velocity by the end of 2023, which means doubling the number of features shipped per employee that directly drive either mDAU (monetized daily active users)  or revenue.
  • Reach at least 315 million mDAU in Q4 2023, which represents a ~20% compound annual growth rate from the base of 152 million mDAU reported in Q4 2019, which was the most recently reported mDAU when Twitter first announced this ambition in March of 2020.
  • At least double total annual revenue from $3.7 billion in 2020 to $7.5 billion or more in 2023.

Snapchat has exploded in popularity over the past few years, and now the company claims its content reaches over 70% of 13 to 24-year-olds across the countries making up more than half of all digital ad spend. 

This reveal came as part of Snapchat’s first-ever investor day, this week.

Snapchat Details User Growth In Surprising Demographics

As The Wall Street Journal reports, Snapchat unveiled several key statistics to shareholders.

Broadly, the company says the “Snapchat Generation” includes up to 40% of consumers around the world.

Despite the perception that the social network’s users are overwhelmingly young, Snapchat also says approximately 80% of its audience is over the age of 18. Based on this level of growth with new audiences, the company believes it will see 50% annual growth in revenue every year for the foreseeable future.

Although most of the information provided focused on big-picture statistics like revenue and audience growth, the shareholder presentation did disclose a few more specific details about how users are interacting with the app. Specifically, they said that Snapchat users open the app 30 times a day on average, every day

Additionally, the company shared that users who try AR filters to try on products are 2.4 times more likely to convert, implying an interest in further investing in this area.

The Future of Snapchat Advertising

One of the main ways Snapchat aims to meet its goal of 50% YoY revenue growth is by continuing to expand its advertising platform.

In its current state, Snapchat’s revenue largely comes from the standard vertical video ads which appear between Stories. However, increasing the number of these ads could drive away users.

Instead of increasing the number of vertical video ads, Snapchat says it plans to find new areas of the app which can be monetized, including placing ads in the Snap Map and Spotlight sections.

With over 35 million businesses already present on the Snap Map, Snap Inc.’s chief business officer, Jeremi Gorman, believes they will see massive interest when rolling out ads in this area of the app.

Driven by the existing success of AR filters, Snapchat also plans to incorporate new augmented reality features and AR-based ad options.

Perhaps most importantly for smaller brands who can’t work directly with Snapchat for the more customized ad options (such as AR or custom filters), the company also says it will be investing in more comprehensive and easier to use tools to buy and run ads through its self-service ad platform.

This means smaller brands will potentially be able to get their hands on some of the more effective and exciting ad options which have only been available to a select few brands on the platform in the past.


Overall, the presentation from the company gives a very optimistic view for the future. With its user-base beginning to age into adulthood, Snapchat is positioned to directly connect brands with some of the most active and engaged users on any social platform out there.

Getting your customers to share user-generated content like pictures with your products may be an unexpectedly powerful tool in swaying over other shoppers.

A new report from eMarketer claims that 62% of consumers are strongly influenced by user-generated content, including being more likely to buy after seeing pictures of a product shared by other shoppers. 

The survey included consumers from around the globe, including in the US, Canada, France, Germany, and the UK.

Why Shoppers Like Customer Photos and Videos

When asked why shoppers responded so strongly to user-generated content like customer photos, the surveyed consumers said:

  • It may highlight something that wasn’t obvious (24%)
  • Like to see a product in action before they buy (21%)
  • Feel more confident that the reviews are accurate (17%)
  • It’s easier to see the quality of a product (17%)
  • It’s easier to see the size/fit or color of a product (11%)
  • It’s easier to see the material of a product (7%)

Unsurprisingly, social media is largely where shoppers are finding this type of content. The survey says more than a quarter of respondents pointed to Facebook as the best place to find customer photos or videos, followed by Instagram, YouTube, Pinterest, TikTok, and Snapchat. 

With all this in mind, eMarketer principal analyst Jeremy Goldman believes user-generated content will only grow in importance for brands.

“Consumers are less trusting of the mainstream media and slick corporate marketing, turning instead to user-generated content and influencers to find their own truth.

“Why would brands spend more time and money on large-scale productions when this option exists, particularly in a world where content must be created and shifted quickly?”

Although the report largely identifies social networks as the key place for user-generated content, it is worth noting that many online retailers are also allowing customers to upload images with products directly in their reviews. By doing this, other shoppers can find this type of information without ever having to leave the page to buy your products.

YouTube’s latest video format, called YouTube Shorts, is finally coming to the USA next month, after several months of testing internationally.

The short (15 seconds or less) vertical video format was first rolled out as a beta test in India back in September 2020. Though it may have taken a little bit to catch on, YouTube says that the number of channels using the video format has more than tripled since December.

Currently, the platform says YouTube Shorts are getting more than 3.5 billion daily views in India alone. 

Come March, US users will be able to see what all the buzz about as the format and associated video creation tools arrive in America.

What Are YouTube Shorts?

Unsurprisingly, many have compared YouTube Shorts to TikTok clips or the popular Stories format found on several other platforms. This is because YouTube Shorts share a number of features with the increasingly trendy format:

  • Users can create and upload short videos of 15 seconds or less.
  • Edit your videos with a range of creative tools.
  • Stitch several short clips together with a multi-segment editor.
  • Add licensed music to your videos through YouTube’s music library.
  • Speed up or slow down your video footage for dramatic effect.
  • Use timers and countdowns to plan your video shoots.

Additionally, the company says it is introducing a carousel on the YouTube homepage dedicated completely to Shorts.

YouTube Shorts Aim To Make Content Creation Easier For All

One of YouTube’s biggest goals with the new video format is to make the barrier to content creation and exposure on the platform lower for new creators:

“Every year, increasing numbers of people come to YouTube to launch their own channel. But we know there’s still a huge amount of people who find the bar for creation too high.

That’s why we’re working on Shorts, our new short-form video tool that lets creators and artists shoot snappy videos with nothing but their mobile phones.”

With YouTube Shorts users can immediately start creating their own content without the need for high-quality equipment or editing skills.

Even more enticing, YouTube says it is going to count Shorts views the same way as regular video views – creating a fast pathway for big metrics for new users. This will also make it easier for new users to reach the milestones needed to monetize content through the YouTube Partner Program.

More is sure to come in the next few weeks as YouTube seems poised to prioritize Shorts in big ways. 

In the next few weeks, the company is launching a dedicated biweekly Shorts Report to highlight all the latest updates and provide useful tips to users. Keep your eyes peeled as new info as the biweekly reports start arriving and YouTube Shorts finally come to the US.

When you think of Pinterest users, most automatically imagine the same general audience – a woman in her 20’s or 30’s. That is slowly changing, however, as a new report from the network shows its users are getting more diverse than ever.

According to the company’s latest quarterly revenue report [PDF], Pinterest’s average monthly active users (MAUs) around the globe has risen 37%, largely driven by increasing popularity with new audiences like men, Millennials, and Gen Z.

Pinterest Rivals Snapchat and TikTok

To put the growth experienced by Pinterest in context, the number of monthly active users puts Pinterest in the same ranks as Snapchat and TikTok – two of the hottest platforms for younger users.

In Q4 of 2020, Pinterest say 98 million monthly active users in the US, while TikTok reported approximately 100 million MAUs. Meanwhile, Snapchat claimed 108 million active U.S. users just last month.

The biggest difference is that although Snapchat and TikTok shot to extreme popularity over relatively short periods of time, Pinterest has consistently been growing for much of its existence. It was only a matter of time before it started to challenge some of the other most popular platforms.

Who Are Pinterest’s New Users?

According to Pinterest, three groups are driving the majority of the company’s growth in recent history – men, Gen Z, and Millennials. As the company stated in a post from July 31, 2020:

“Gen Z and Millennials are driving much of our growth, with the number of men on Pinterest also jumping nearly 50% year on year, too.”

Notably, it seems each demographic is creating their own unique trends on the platform, motivated by their unique needs at their varying stages of life. 

For example, Gen Z pinners have inspired a wave of beauty trends focused on ethically expressing themselves, including trending keywords like “Indie beauty” and “Rainbrows.”

On the other hand, Millennials are participating more in trends like “More door” which help make them make the most of their homes.

As for men, it seems a lot of the attraction is the popularity of food and DIY projects. 

As Pinterest’s users and trends continue to diversify, it only makes sense that the company has been expanding the tools and features available to make it easier to target specific audiences across the platform. If this pattern continues, it is possible Pinterest could be the sleeper hit which one day could be as widely used as Instagram, Twitter, or even Facebook.

Google My Business has officially launched a new label that highlights the number of years you’ve been in business within local search results.

The “years in business” label has been in testing over the past few years, and was quietly launched officially on February 9th, 2021.

While it is just a small label added to your listing, this could prove to be a significant way to differentiate yourself in the crowded “local pack” search results.

As Google put it in the announcement, you can now “add an opening date to your Business Profile to tell customers when your business first opened, or will open, and its address.”

To get an idea of what the label looks like, Barry Schwartz from RustyBrick (and who first noticed the launch of the label) took a screenshot of his own business listing with the new tag.

Source: Barry Scwhartz/RustyBrick, Inc.

How To Get The ‘Years in Business’ Tag

Adding this label to your own Google My Business listing is relatively simple. All you have to do is add the open date of your business within your GMB profile. 

To do this, just sign into your GMB account, click the location you want to update, then select the “info” option in the menu. From there, click “add opening date”, update with your own date you opened up shop, and voila. The label should be added to your local listing within the next few days.

“I’ve Been Seeing This Label For Months”

Many might have noticed that Google has been slowly adding this label to many of the listings which are eligible over the past year. Users first spotted the tag way back in September of 2020, with a larger roll out done in November.

Still, this week marks the official launch of the feature for all Google My Business listings.

How This Helps You

Thanks to bad actors listing non-existent or questionable businesses within Google My Business, it has become more important than ever to visibly show that you are a real, active, and trustworthy business within your listing.

This feature allows you to quickly do this by showing you have been a part of your community for years – if not decades – and won’t be going anywhere anytime soon.

According to an update on the YouTube Help page, Google Analytics has stopped collecting new data from YouTube channels beginning February 1st. 

While older data is still available, any new information will be available solely through YouTube Studio. 

The change doesn’t come as a particularly big surprise. Users lost the ability to link Google Analytics and YouTube pages in November of last year. However, connected channels were able to keep tracking data from YouTube until now. 

Most likely already rely on YouTube Analytics for monitoring their channel performance, as it has always offered significantly more information compared to what could be found in Google Analytics. The ability to track major YouTube metrics through Google’s tool set was more about conveniently checking both platforms at the same time. 

Still, those affected received little warning about the change. The only information relating to the decision was buried in a YouTube Help page. 

What You Should Know About YouTube Analytics

While YouTube Analytics offers all the information you have come to expect from Google Analytics (and more), there are a couple key differences. 

Most importantly, you don’t have to add any tracking code, pixels, or anything else to get your data. YouTube collects information about engagement, views, and more for your channel and videos automatically. 

You will also find more granular information, with everything from specific audience details for every video on your channel, revenue information, and search terms used to find your channel. 

All of this is collected within five main tabs:

  • Overview: This section collects essential broad metrics for your channel, like watch time, total views, and subscribers. Here you will find reports addressing top videos, realtime activity, latest videos, and average performance. 
  • Reach: The ‘Reach’ tab shows your overall connection with YouTube users with data on impressions and clicks. Users can get reports for traffic source types, top external sources, impressions, and search terms in this section.
  • Engagement: Now, we start moving deeper to exactly what your viewers are watching on your channel as shown by total watch minutes. Read reports for top videos and playlists, top cards, and end screens here.
  • Audience: Explore who your viewers are with data on unique viewers, average videos watched per viewer, and overall subscriber growth. Reports included here cover audience location, demographics, and other channels they interact with. 
  • Revenue: If you are a member of the YouTube Partner Program, you will also find this tab that addresses how much money is being generated through monetized videos. 

For a brief guide on YouTube Studio Analytics, watch the video from the YouTube Creators channel below:

Google is introducing a new label to highlight Black-owned businesses in Google Shopping search results. 

This is intended to help shoppers prioritize minority-owned and operated businesses or products when shopping online if they desire. 

The search engine originally launched the label in July 2020 to highlight Black-owned businesses in Google My Business pages and local searches. 

The label is small and unobtrusive, simply reading “Identifies as Black-owned” when viewing a company’s Google My Business or Google Shopping listings. You can see what it looks like in action below:

Who Can Get The Label

Notably, the label doesn’t appear to require any verification, which may explain the “Identifies as” part of the tag. For the moment, though, the label is only launching in the U.S.

As Google says:

“Starting today, we’re extending the Black-owned attribute to Google’s shopping tab, so people can easily identify and but-from Black-owned businesses on Google … [This] feature will become visible to shoppers and available to all U.S. Google Merchants in coming months.”

How To Add The Label 

The process of adding the tag to your own product listings is managed entirely within the Google Merchant Center.

To do so:

  • Sign in to your Merchant Center account
  • Select the “Tools and Settings” menu in the top-right corner of the page.
  • Find the “Business information” page.
  • Go to the “About your business tab” and scroll to the “Business identity attributes” section.
  • Select the “Identifies as Black-owned” attribute and any others relevant to your business.
  • Select “Include my business in promotions for Black-owned businesses” if you would like to be highlighted in pages showcasing Black-owned businesses.

Why Google Is Expanding The Black-Owned Business Label

As the search engine explains in the announcement, over “the past 12 months, Google search interest for ‘Black-owned businesses’ has skyrocketed 600% based on Google Trends data comparing January-December 2019 to January-December 2020. Across the country, people have been looking for ‘Black-owned restaurants,’ ‘Black-owned bookstores,’ ‘Black-owned beauty supply’ and more, which speaks to the diversity within the Black business community.”

Even more, Google says it wants “to make it easier for people to support and spend dollars with the Black businesses they love.”

Google is warning brands that Web Stories which don’t follow through on their promised content may but cut from appearing in Google Search and Google Discover.

In an announcement, the company explained that users have expressed disinterest in Web Stories which “tease” content but require users to click through to get the full experience. As such, brands using this style of Web Story run the risk of having their content demoted.

What Are Google Web Stories?

Google’s take on the popular Story format first appeared back in 2018, going by the name of AMP Stories. 

These quick, visual posts or ads function almost identically to Facebook or Instagram Stories, but appear within the Google mobile app when exploring the Discover tab or searching for websites.

One thing that makes Google’s version of these posts unique, however, is that Web Stories can easily be shared to any platform, including competing social networks.

What This Change Means For You

In the announcement, Google’s Paul Bakaus explains that “a one- or two-page teaser for your blog post doesn’t tell a satisfying story to a reader, so Google will do its very best to not show these to users.”

With this in mind, Google is planning to stop showing “teaser” based Web Stories across its platform. 

If you are concerned your Web Stories may be affected, Google recommends following a few Do’s and Don’ts:

Dos:

  • A shopping inspiration list that highlights products and links out to places where you can buy them.
  • A short version of a recipe with complete ingredients listed that leaves more detailed instructions behind a click.

Don’ts:

  • A one-page story that mentions a recipe in the headline, but is just a bunch of photos that redirect to the website.
  • A list highlighting beautiful cities in Europe, but just listing a city and a photo and pointing to the blog link for any actual information.

It is worth noting that the above example image Google shows of a recipe web story actually clearly falls into the “Don’t” category here. This highlights how unclear the actual implementation of this new policy is currently.

People are Tired of Clickbait

As Bakaus notes, users expect complete content from Stories, not a lure leading to a comprehensive blog post.

“Unfortunately, from what users are telling us, this isn’t what they want. Instead, web stories are best when they tell a full story and aren’t used to “tease” other content.

“Readers don’t like to feel forced to click through to a connected blog post to finish reading.”

How This Affects Monetization

One of the biggest reasons many brands used “teaser” Web Stories was to help drive traffic to their own monetized content. This new policy could potentially disrupt this strategy entirely. 

Despite this, Google urges you to “think about the users consuming [Web Stories] and how Google showcases them.”

At the same time, the company notes that “you can directly monetize Web Stories with in-between-page ads.”

Bakaus does admit this may not be as effective or lucrative, though the company hopes to improve this situation in the future:

“A well-optimized blog post might still make you more money today, but ad networks are working on building out and expanding their Web Story integrations, so you should see both CPMs and fill rates improve over time.”

You can hear Paul’s full explanation of the policy and the best practices for creating Web Stories in his Google Web Creators video below: