After a prolonged period of testing, Google Ads has officially launched the new Insights page to all advertisers.
As the company announced, starting April 14th, 2021, “the Insights page is available to all advertisers globally.”
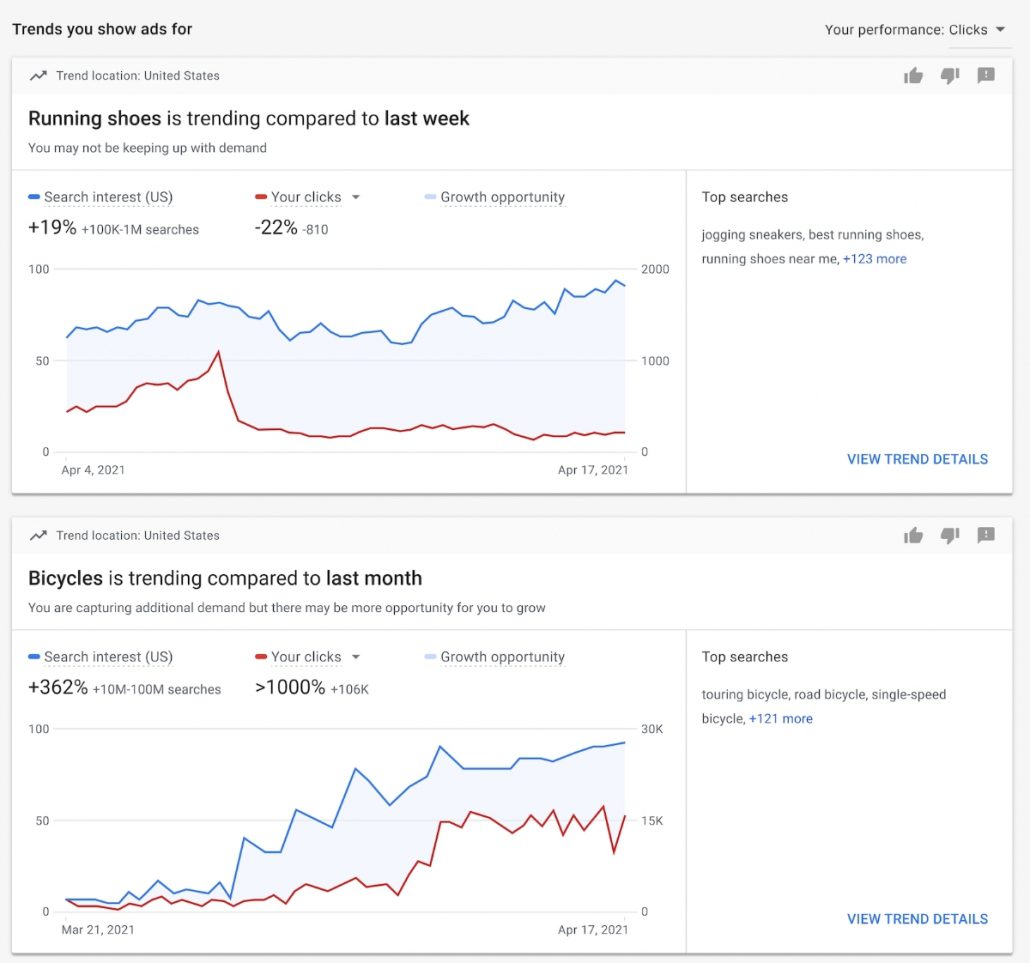
The Insights tool allows for advertisers to easily track and explore emerging trends in your industry to create more effective ads.
The latest announcement gives an example of how a brand could use the tool:
“Let’s say you’re a pet store looking to reach more customers. With the Insights page, you can see rising demand for ‘dog subscription boxes’ and ‘dog toys’. You can then act on these trends by creating campaigns to reach new pet owners, or even explore selling dog care packages.”
“The Insights page surfaces trends tailored to your business, so you can see if you’re keeping up with demand for trending products or services,” continued the statement.
How Google Ads Insights Works
The new tool pulls data from your account’s performance history and campaign settings, before combining them with search trends across Google to automatically show you relevant trends and insights.
Currently, the Insights tool only provides one type of data, showing search trends to help you better understand the most recent patterns in search behavior and identify relevant trends in your market.
However, Google Ads says it will be rolling out more types of insights in the future.
For more information about the new page, Google Ads has published a help document to get you started tracking the latest trends in your industry.
https://www.tulsamarketingonline.com/wp-content/uploads/2020/01/GoogleRankings.png360640Taylor Ballhttps://www.tulsamarketingonline.com/wp-content/uploads/2018/07/TMO-Logo.pngTaylor Ball2021-04-15 15:59:302021-04-15 15:59:32Find The Latest Industry Trends With Google Ads’ New Insights Page
YouTube is the most popular social network among American adults according to a large new study from Pew Research Center.
The new report includes findings on social media use among adults from a nationally representative phone survey conducted earlier this year.
Overall, the results showed that social media usage has largely remained stagnant over the past few years, with just two notable exceptions.
“YouTube and Reddit were the only two platforms measured that saw statistically significant growth since 2019,” the reports stated.
Out of all platforms, YouTube had the highest usage with 81% of adults who used any kind of social media saying they used the video streaming service.
Facebook unsurprisingly came not far behind, with 69% saying they use the platform. In third place was Instagram with 40% of respondents saying they use the social network.
You can see the full list of social networks and the percent of US adults who use them below:
YouTube (81%)
Facebook (69%)
Instagram (40%)
Pinterest (31%)
LinkedIn (28%)
Snapchat (25%)
Twitter (23%)
WhatsApp (23%)
TikTok (21%)
Reddit (18%)
Nextdoor (13%)
As the report concludes:
“YouTube is the most commonly used online platform asked about in this survey, and there’s evidence that its reach is growing. Fully 81% of Americans say they ever use the video-sharing site, up from 73% in 2019. Reddit was the only other platform polled about that experienced statistically significant growth during this time period – increasing from 11% in 2019 to 18% today.”
Beyond these broad findings, the report also includes demographic breakdowns for each platform and other findings, which you can see below:
YouTube Usage Statistics
95% of US adults ages 18 to 29 say they use YouTube
91% of US adults ages 30 to 49 say they use YouTube
49% of US adults ages 65 and older say they use YouTube
54% of YouTube users say they visit the site daily
36% of YouTube users say they visit the site several times a day
Facebook Usage Statistics
70% of US adults ages 18 to 29 say they use Facebook
77% of US adults ages 30 to 49 say they use Facebook
73% of US adults ages 50 to 64 say they use Facebook
50% of US adults ages 65 and older say they use Facebook
70% of Facebook users say they visit the site daily
49% of Facebook users say they visit the site several times a day
Instagram Usage Statistics
71% of US adults ages 19 to 29 say they use Instagram
52% of Hispanic Americans say they use Instagram
49% of Black Americans say they use Instagram
35% of White Americans say they use Instagram
59% of all Instagram users say they visit the site daily
73% of 18- to 29-year-old Instagram users say they visit the site every day
53% of 18- to 29-year-old Instagram users say they visit the site several times a day
Other Usage Statistics
46% of Twitter users say they visit the site every day
65% of 18- to 29-year-olds say they use Snapchat
2% of adults ages 65 and older say they use Snapchat
50% of 18- to 29-year-olds say they use TikTok
Those with higher levels of education are more likely to use LinkedIn than those with lower levels of education
51% of US adults with a bachelor’s or advanced degree say they use LinkedIn
28% of US adults with only some college experience say they use LinkedIn
10% of US adults with a high school diploma or less say they used LinkedIn
46% of women use Pinterest, compared to 16% of men
Adults living in urban (17%) or suburban (14%) areas are more likely to say they use Nextdoor
https://www.tulsamarketingonline.com/wp-content/uploads/2020/08/YouTubeTrendsBannerSmall.jpg360640Taylor Ballhttps://www.tulsamarketingonline.com/wp-content/uploads/2018/07/TMO-Logo.pngTaylor Ball2021-04-13 19:15:562021-04-13 19:15:57YouTube Is The Most Popular Social Network Among US Adults [Study]
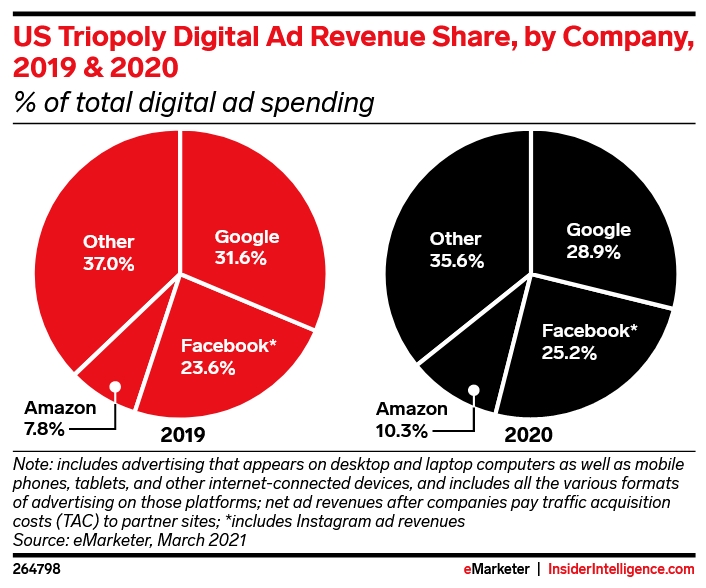
For years, two names have ruled the online ad game – Google and Facebook. Currently, that is still true, though a new analysis suggests Amazon is steadily expanding its ad business to be a sizable challenger to the Big Two.
Research firm eMarketer’s latest annual digital ad report shows that Amazon’s share of digital ad revenue broke two digits in 2020, earning 10.3% of U.S. online ad revenue. That’s a significant jump from 7.8% in 2019.
In actual dollars, the online retail giant’s ad revenue reached $15.73 billion, an increase of more than 50% from the previous year.
Should Facebook and Google Be Worried?
Amazon still has some ways to go before it’s ad platform is the size of Google or Facebook’s – both of which receive more than 20% of U.S. digital ad spend.
Still, eMarketer predicts the company will continue to increase its share of online ad revenue over the next few years until it is on par with the other two giants.
For Facebook, this might not be a big concern since much of Amazon’s advertising is driven by Amazon Prime video advertising and product ads. In their current form, both platform’s ads largely serve different purposes.
Google, on the other hand, might be getting a little nervous. Over the past few years, the search engine has been investing heavily into its online shopping services, as well as expanding YouTube’s advertising platform.
What Does This Mean For Brands?
Though this might have significant implications for the future of online advertising, nothing has really changed for the majority of brands who might use these platforms for their ads.
However, it does serve as a reminder that there are more than just the Big Two online ad platforms. Many of the others out there may be a better fit, provide less competition, and allow you to reach your potential customers at a more ideal time. This is why it is important to know what each has to offer and invest your ad budget into the platform (or platforms) which make the most sense for you.
https://www.tulsamarketingonline.com/wp-content/uploads/2021/04/Amazon-Ads.jpg360640Taylor Ballhttps://www.tulsamarketingonline.com/wp-content/uploads/2018/07/TMO-Logo.pngTaylor Ball2021-04-07 20:39:432021-04-07 20:39:44Amazon Now Gets More Than 10% Of All Digital US Ad Revenue
It can be easy to forget that online marketing can have a much wider effect than just “online”. These days, it is also one of the most powerful tools businesses have to drive in-person and other types of offline sales.
The key is knowing how to optimize specifically for local searches to help those nearby find you and your products or services at the most effective times.
To help smaller businesses do this, Google recently published a small guide with 4 tips and ideas for driving offline sales using your online ads and marketing.
Creating In-Person Sales With Online Marketing
Establish Your Digital Storefront
The first step to using your brand to drive local sales is establishing your Google My Business profile. This allows you to appear in the prime search results placements for relevant localized searches.
As Google says:
“Stand out when people search for your business, products or services. Getting your business on Google is the essential first step towards driving and measuring visits to your stores.”
2) Measure Your Offline Impact
These days, the search engine’s analytics tools can measure a lot more than online traffic and conversions. Using metrics like Store Visits and Local Actions, you can see exactly how effective your online ads and marketing are in the real world.
“Getting the full picture of how your ads drive impact across channels is important to refine campaigns, make budgeting decisions, and inform your overall business strategy.”
3) Optimize For Online AND Offline
Use ads and optimization to highlight what you have online and what you have to offer at your brick and mortar locations. Not only can you use Google Shopping to showcase your products in search results, you can specifically promote your in-store inventory using Local Inventory ads.
The guide suggests:
“Make the most of your marketing investment and grow revenue for your stores, whether customers ultimately purchase online or in-store.”
4) Showcase Your Locations
Use local campaigns to highlight your local stores and send online searchers straight to your door.
“Machine learning makes it easier and more efficient to promote your physical business locations at scale across Google properties. It can help you reach customers throughout their purchase journey and optimize for those who are most likely to visit your business.”
https://www.tulsamarketingonline.com/wp-content/uploads/2021/04/Online-to-Offline.jpg360640Taylor Ballhttps://www.tulsamarketingonline.com/wp-content/uploads/2018/07/TMO-Logo.pngTaylor Ball2021-04-06 17:02:212021-04-06 17:02:23How To Drive Offline Sales With Online Marketing and Ads
Facebook quietly revealed that it will be closing the Facebook Analytics service effective June 30th, 2021. After that date, brands and marketers will be unable to access their data. You can export your data to bring over to a new analytics service until then, though.
“Facebook Analytics will no longer be available after June 30, 2021. Until then, you will still be able to access reports, export charts and tables, and explore insights. To export data into a CSV file from Facebook Analytics on your desktop, click the arrow in the top-right corner of each chart or table.”
It is notable that the announcement did not explain the decision in any way. Instead, it simply pointed users to other tools which can replace some of the tracking and analytics features – though not all.
Among the recommended tools Facebook directed users to are:
Facebook Business Suite allows you to manage your Facebook and Instagram business accounts and can show you detailed insights about your audience, content and trends. (This tool may not be available to you yet.)
Ads Manager lets you view, make changes and see results for all your Facebook campaigns, ad sets and ads.
Events Manager can help you set up and manage Facebook Business Tools like the Facebook pixel and Conversions API, and reports actions taken on your website, in your app and in your physical store.
The quick shuttering of Facebook Analytics will make it more possible than ever to track users’ behavior on the platform. Even more frustrating for many, the primary recommended tool, Facebook Business Suite, is limited specifically to small businesses and is not actually available to the public yet. That means that there is less time to learn the more narrowly-focused tool during the transition period.
https://www.tulsamarketingonline.com/wp-content/uploads/2021/04/Goodbye-Facebook-Analytics.jpg360640Taylor Ballhttps://www.tulsamarketingonline.com/wp-content/uploads/2018/07/TMO-Logo.pngTaylor Ball2021-04-01 19:11:122021-04-01 19:11:14Facebook Suddenly Announces It Is Shutting Down Facebook Analytics
For many small-to-medium businesses, appearing in search results around their local area is significantly more important than popping up in the results for someone halfway across the country.
This raises the question, though. How many of the countless searches made every day are actually locally based?
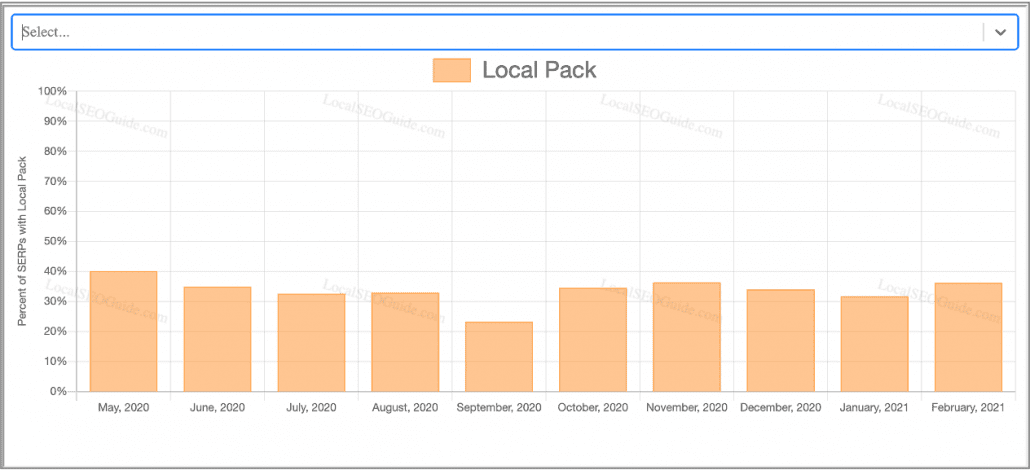
Working together, the companies analyzed over 60 million U.S. search queries and found that over a third (approx. 36%) of all queries returned Google’s local pack – indicating the search was location-based.
Perhaps the biggest surprise from the data is that locally-based searches have remained largely consistent throughout the year. Following an uptick in early 2020 (likely driven by the coronavirus pandemic), the rate stayed around 36% over the course of the year. The only significant exception came in September, where the data shows a significant decrease in locally-driven searches.
This data shows just how important it is for even brands that are strictly local to establish their brands online and optimize for search engines. Otherwise, you might be missing out on a big source of potential business.
Other Features In The Local Pack-O-Meter
Along with data on the appearance of local packs in Google search results, the Local Pack-O-Meter includes information on several other search features. These include:
Knowledge Graphs
“People Also Ask” Panels
Image Boxes
Shopping Boxes
Ads
Related Searches
And more
Though the current form of the tool doesn’t include ways to more selectively filter the information, there is plenty to take from the information for planning what search features you need to prioritize and which can be put on the back burner.
To explore the Local Pack-O-Meter for yourself, click here.
https://www.tulsamarketingonline.com/wp-content/uploads/2021/03/NearMeLocalSEO640px.jpg360640Taylor Ballhttps://www.tulsamarketingonline.com/wp-content/uploads/2018/07/TMO-Logo.pngTaylor Ball2021-03-30 17:26:352021-03-30 17:26:37Over One-Third of Google Searches Are Local
If you are an online retailer, you are no doubt familiar with Google’s wide array of special features built for online shopping. You are also probably aware of how confusing it can be to get included in these unique search results.
To help clarify this process and make it easier to get your products highlighted in Google’s search results, the search engine recently revealed some technical tips and tricks for e-commerce sites.
Why It Takes Extra Work To Get In Google Shopping Results
The first question most business owners or site managers might have when they start trying to get their products included in Google Shopping results is “why do I have to do all this extra work?”
Google’s whole thing is analyzing sites and automatically delivering that information in its search results, right? Why can’t they just pull your product info when your pages get indexed?
The simple answer is that Google knows online retail changes very quickly and shoppers get very frustrated with out of date or inaccurate information. If this became a frequent problem, users would likely stop paying attention to Google’s product-related search results.
While the search engine regularly re-indexes updated webpages, it can’t guarantee pages will be indexed fast enough to ensure information is up-to-date for searchers.
Additionally, there are some features which online retailers tend to provide to help shoppers which can make things a little confusing for search engines to understand.
For example, Google says it still struggles with accurately telling the difference between these types of information:
Original Price vs. Discounted Price
Related Products vs. The Main Product Being Sold
Taxes or Shipping Costs vs. The Actual Product Price
This is why the search engine asks online retailers to help provide this information for Google Shopping results.
Now, let’s get into the advice from Google Developer Advocate Alan Kent and how you can get your products into Google product showcases.
Two Ways To Give Google Your Product Data
In the latest Lightning Talks video, Kent discusses two different ways site managers can get their product information to Google.
The first method is by using structured data. This is essentially using special coding embedded into pages to provide Google with additional information typically not provided through regular site code or markup.
This is generally seen as the advanced approach because it requires significant knowledge of coding and the latest structured data techniques.
The other method covered by Kent is by directly providing product data through Google Merchant Center, which can be done with:
A feed of all product data manually submitted to the search engine.
An API developed to update products individually as changes are made on your site.
While providing product data to search engines is essential for appearing in these specific product-centric search results, the company emphasizes that these practices don’t replace traditional SEO.
“Remember that SEO still matters for organic search. Make your product details, such as images and descriptions, appealing to your customers.”
If you want to watch the full explanation from Kent, it is available below:
https://www.tulsamarketingonline.com/wp-content/uploads/2020/04/google_shopping_competitors_Img.png6001000Taylor Ballhttps://www.tulsamarketingonline.com/wp-content/uploads/2018/07/TMO-Logo.pngTaylor Ball2021-03-25 15:56:272021-03-25 15:56:28Google Explains How To Get Your Products Featured In Search
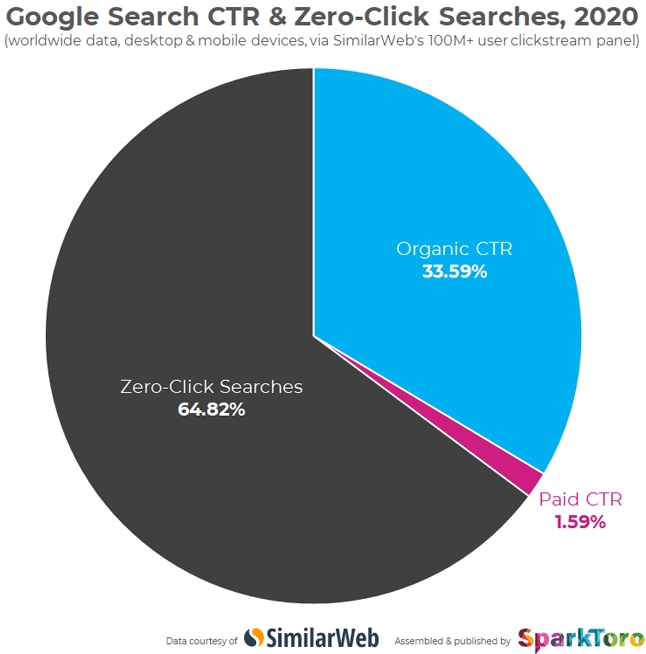
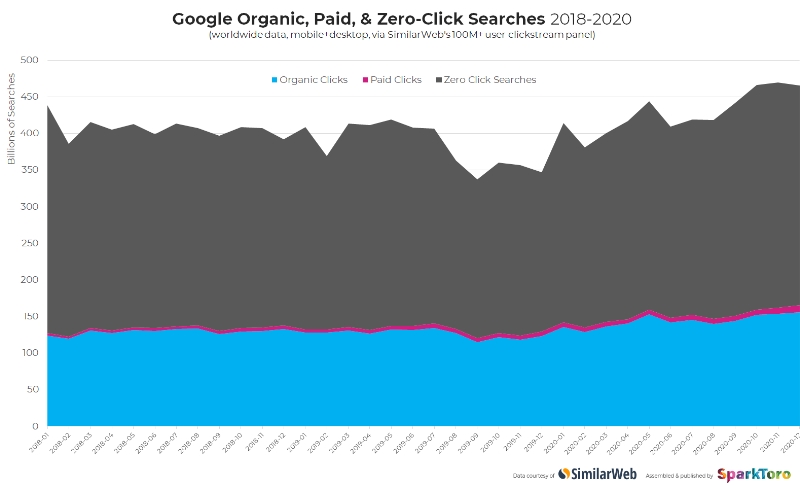
Throughout 2020, approximately 65% of searches made on Google were “zero-click searches”, meaning that the search never resulted in an actual website visit.
Zero-click searches have been steadily on the rise, reaching 50% in June 2019 according to a study published by online marketing expert Rand Fishkin and SimilarWeb.
The steep rise in these types of searches between January and December 2020 is particularly surprising because it was widely believed zero-click searches were largely driven by mobile users looking for quick-answers. Throughout 2020, however, most of us were less mobile than ever due to Covid restrictions, social distancing, and quarantines.
The findings of this latest report don’t entirely disprove this theory, though. Mobile devices still saw the majority of zero-click Google searches. On desktop, less than half (46.5%) were zero-click searches, while more than three-fourths (77.2%) of searches from mobile devices did not result in a website visit.
Study Limitations
Fishkin acknowledges that his reports do come with a small caveat. Each analysis used different data sources and included different searching methods, which may explain some of the variance. Additionally, the newer study – which included data from over 5.1 trillion Google searches – had access to a significantly larger data pool compared to the approximately one billion searches used in the 2019 study.
“Nonetheless, it seems probable that if the previous panel were still available, it would show a similar trend of increasing click cannibalization by Google,” Fishkin said in his analysis.
What This Means For Businesses
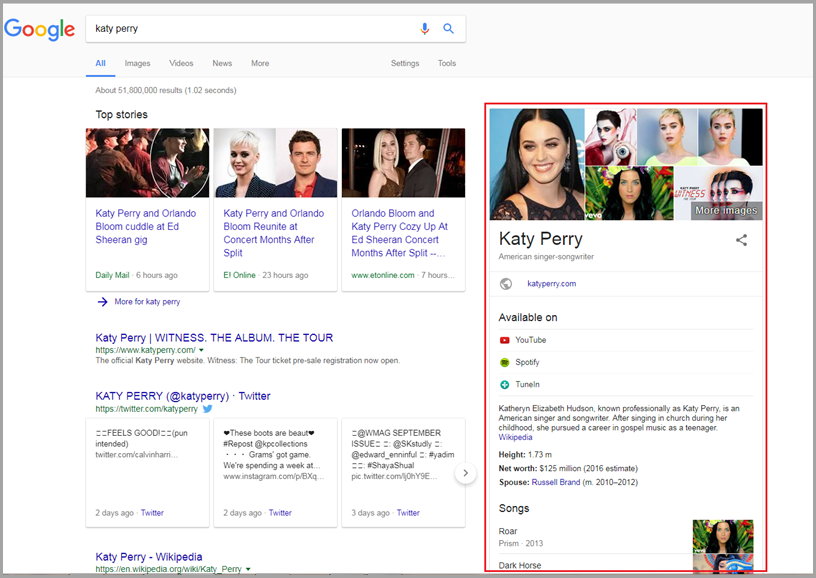
The most obvious takeaway from these findings is that people are increasingly finding the information they are looking for directly on the search results pages, rather than needing to visit a web-page for more in-depth information.
It also means that attempts to regulate Google are largely failing.
Many have criticized and even pursued legal action (with varying levels of success) against the search engine for abusing their access to information on websites by showing that information in “knowledge panels” on search results.
The argument is that Google is stealing copyrighted information and republishing it on their own site. Additionally, this practice could potentially create less reason for searchers to click on ads, meaning Google is contributing to falling click-through rates and making more money off of it.
Ultimately, Google is showing no signs of slowing down on its use of knowledge panels and direct answers within search results. To adjust to the rise of zero-click searches, brands should put more energy into optimizing their content to appear in knowledge panels (increasing your brand awareness) and diversify their web presence with social media activity to directly reach customers.
https://www.tulsamarketingonline.com/wp-content/uploads/2020/01/GoogleRankings.png360640Taylor Ballhttps://www.tulsamarketingonline.com/wp-content/uploads/2018/07/TMO-Logo.pngTaylor Ball2021-03-23 14:53:572021-03-23 14:53:59Almost 65% of Google Searches Don’t Lead To A Website Visit
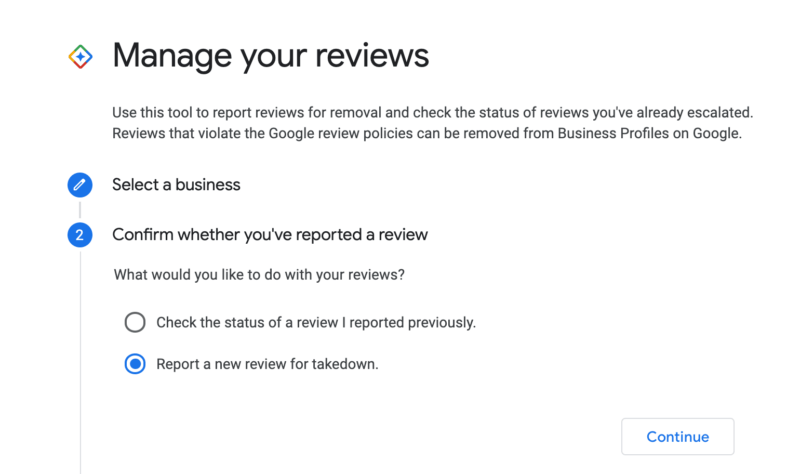
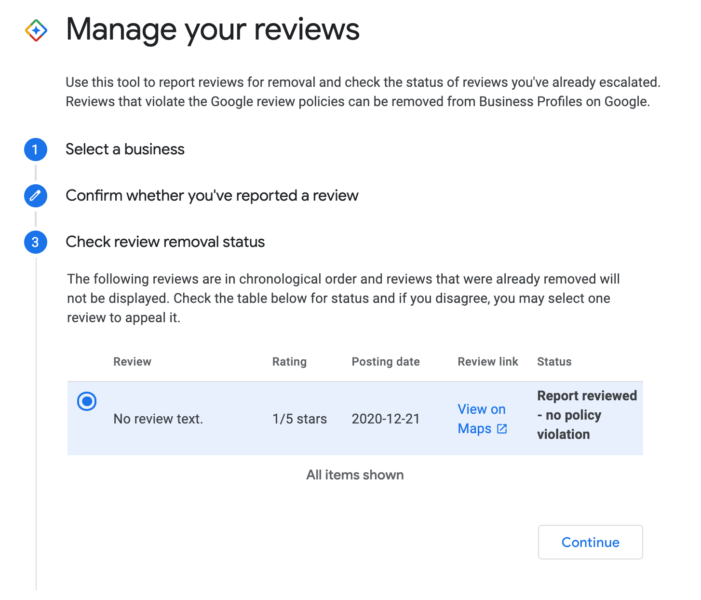
Google My Business is finally giving businesses a little more information and control over their reviews with a new tool available here.
Through the tool, business owners or managers can view reviews, submit a request to remove misleading or problematic reviews, and check the status of takedown requests for these reviews.
To get started, simply sign into the Google account related to your business and go to the help page.
From there, select whether you want to check the status of a review or file a new report for a problematic review.
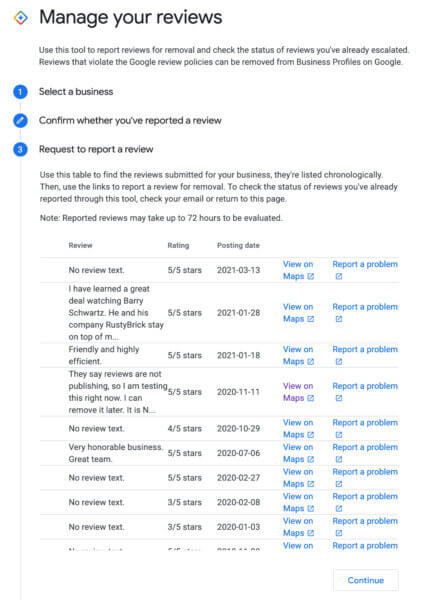
If you wish to submit a new takedown request, Google My Business will pull a list of your recent reviews which can be viewed and reported within the tool.
If you are simply checking the status of a past takedown request, the tool will show all your most recent requests along with information about the status of the request.
If you select a review, you can also get more in-depth information about the review and request. You can also submit an appeal from here if you believe a request has been improperly denied.
Only Available For Small Accounts
At this point, it appears the tool is only available for accounts with just a few Google My Business listings. Several SEO specialists who manage dozens or even hundreds of listings say they have received a message stating “Based on the number of Business Profiles you manage, this process is not available” when attempting to use the tool. It is unclear if or when GMB plans to expand the tool for larger accounts.
https://www.tulsamarketingonline.com/wp-content/uploads/2020/01/Google-Reviews.png290640Taylor Ballhttps://www.tulsamarketingonline.com/wp-content/uploads/2018/07/TMO-Logo.pngTaylor Ball2021-03-18 17:55:392021-03-18 17:55:41New Google My Business Tool Helps Manage Your Reviews
YouTube is expanding the amount of data available to video creators while rolling out an updated version of the YouTube Studio Mobile app.
Accompanying the release of the updated app, the video platform is offering video creators new information on traffic sources, returning viewers, and more in-depth data on how viewers are watching your content.
Below we are going to dig into the new metrics and app in-depth:
Expanded Viewer Data In YouTube Studio
Living Room Impressions
Before the end of the month, YouTube says it will start showing creators data on what it is calling “living room impressions” or views coming from TV-based sources like built-in TV apps, Rokus, or video game consoles.
Of course, YouTube has already been counting these streams within its broader metrics like watch time and total views. However, this allows you to see exactly how your viewers are engaging with your content and help optimize your videos for where most people are viewing them.
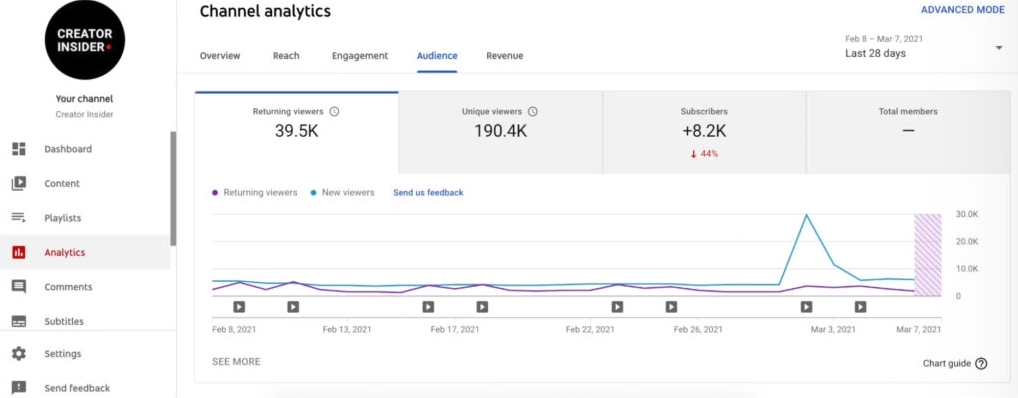
New or Returning Viewers
Though you have been able to see how many new subscribers you are getting since seemingly forever ago, YouTube has generally overlooked the group of viewers who keep returning to channels even if they aren’t actually subscribed. In many ways, these viewers can be more valuable because they are actively searching out your content on a regular basis, rather than simply relying on it to pop up in their feed.
Now, YouTube is introducing a metric breaking down which viewers are new to your channel and who is returning – whether they are subscribed or not.
Not only does this provide a more accurate view of your channel’s health and community engagement, it also helps you plan topics based on past viewer response.
Despite this data being available to the vast majority of creators, YouTube says it will not be present for copyrighted content owners or artistic channels.
Updates to YouTube Studio Mobile
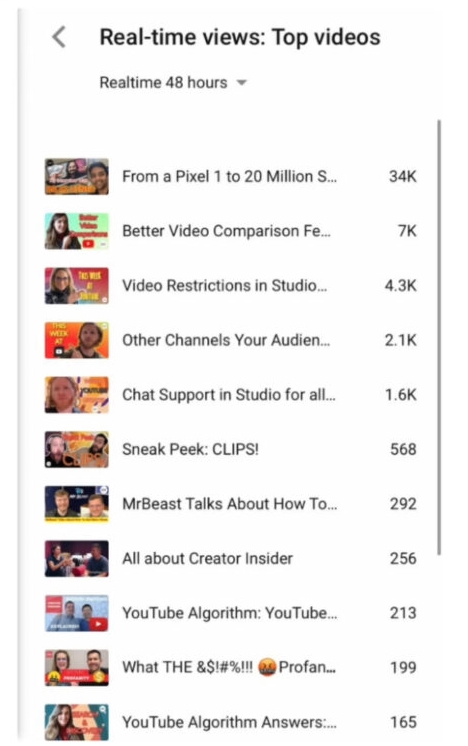
Redesigned Real-Time Data Card
YouTube is updating its real-time analytics card in the Studio Mobile app analytics section to make it easier to see exactly how specific videos are performing in the moment. These changes include:
Thumbnails: The real-time card now displays thumbnails for individual videos.
Sorting: The real-time card now sorts videos by view count rather than the date videos were published.
Amount of videos: The card now shows up to 15 videos – ten more than the previous limit of five videos.
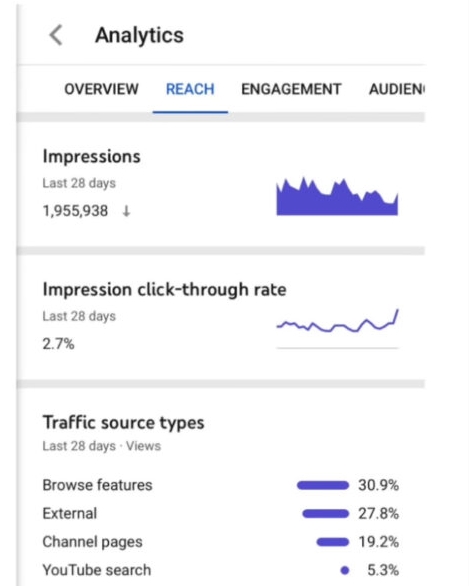
Updates to Tabs
Along with the new data, YouTube is redesigning its tabs in the Studio Mobile app with a larger focus on alignment. Following the update, all the most-used tabs are aligned, including audience, reach, engagement, overview, and revenue.
At the same time, the company has removed a few cards from these tabs, saying the cards were rarely used on mobile. All of these sections are still fully visible on desktop.
For more information on the new metrics available and the refreshed app, watch the Creator Insider video below:
https://www.tulsamarketingonline.com/wp-content/uploads/2020/07/YouTube-Search.jpg10022240Taylor Ballhttps://www.tulsamarketingonline.com/wp-content/uploads/2018/07/TMO-Logo.pngTaylor Ball2021-03-16 18:02:302021-03-16 18:02:32YouTube Updates Studio Mobile App and Introduces New Data Metrics