Social media is all about crafting an image and that starts at the profile and cover photos. These pictures are the first things visitors see when they come to your profile, and it is essential to maintain a consistent image across social media. Unfortunately, trying to prepare your photos in the ideal sizes and specifications for the wide array of social media platforms can be a headache.

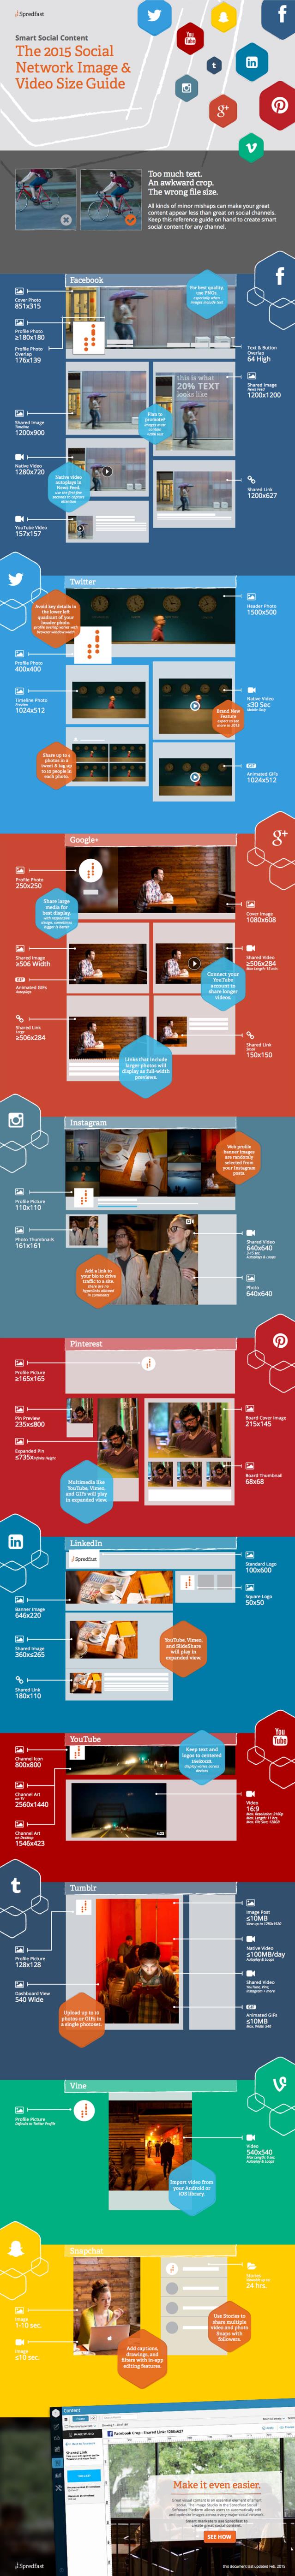
Every single social media site has their own specific sizes for images and many of the specs can seem almost random. Facebook requires 851px by 315px, while Google calls for 1080px by 608px and images on LinkedIn are supposed to be 646px by 220px. You can spend your time trying to come up with a mnemonic device to try to keep all the different image specs straight, but chances are your time is better spent elsewhere.

Thankfully, the team at Spredfast created a handy infographic which lays out the most recent photo specs for pretty much any social network you are likely to be on. The graphic details all the ideal photo sizes for profile pics and cover photos, as well as detailing the optimal sizes for posting photos to make sure cropping won’t ruin the image.

 Social Image Size Infographic

Google Mobile

Google has been giving webmasters some pretty heavy hints that mobile-friendliness was important to the search engine, and today the company made it official. Mobile-friendliness and indexed apps are officially ranking factors in search results.

The motive behind the addition to the search engine algorithms is fairly obvious. People are using mobile devices more and more to search the web, and mobile-focused ranking factors such as these are the best way to ensure quality results no matter what device you come from.

The mobile algorithm update won’t take effect until April 21, so you have time to make any necessary changes you may have been procrastinating on until now.  Google also says the update will affect all mobile searches in any language around the world.

If you are concerned your site may not be up to Google’s mobile standards, they offer a mobile-friendly test. Google also suggests examining mobile usability issues by reviewing the Mobile Usability Report in Google Webmaster Tools.

In the meantime, Google will begin considering information from indexed apps as a ranking factor for signed-in users with the app installed on their phone. This way, content from indexed apps on your phone have the potential to rank higher in the search results you see. As a side-effect however, app developers will have to establish a relationship between their sites and app deep links.

The release of Google My Business was intended to make it easier for businesses to maintain a consistent appearance across all of Google’s services, but one feature was seriously lacking. While Google My Business allowed businesses to upload an image to their profile, the companies still had difficulty controlling which images would be used in various listings.

That is a serious problem when you are trying to establish a consistent brand presence online.

Screen-Shot-2015-02-23-at-2.24.26-PM-515x600

Today, Google announced a major update to Google my Business that finally gives companies some agency in their appearance across Google’s platform. As the announcement explains:

Starting today, you can tell us which image you’d like to appear when customers search for your business on Google. Just log in to Google My Business on the web or in the Android or iOS apps, and visit the Photos section. While you’re there, you can also give your business a fresh look online by updating your profile, logo and cover photos.

Google My Business Photos

The upgrade unifies Google’s three interfaces for images into one simple interface. There is no longer any guesswork in making sure your brand is always presented how you want it on the search engine.

Google Help Files explains the best practices for uploading photos for your business:

Your photos will look best on Google if they meet the following standards:

  • Format: JPG, PNG, TIFF, BMP
  • Size: Between 10KB and 5MB
  • Minimum resolution: 250px on the longest side for profile & logo photos; 720px on the longest side for other business photos
  • Aspect ratio: The longer dimension of the photo should be no more than four times the shorter dimension. Landscape photos look better than portrait photos on Google products. Panoramic photos may use different aspect ratios.
  • Quality: The photo should be in focus, well-lit, have no photoshop alterations, and no excessive use of filters. The image should represent reality.

Online reviews can be the deciding factor in the success of small businesses or companies that are just starting out, and yet many businesses ignore the single most powerful free form of marketing. This infographic from Web Republic breaks down the current trends and effects of reviews including:

  • Amazon is the leading review site in America and 42% of all its customers have left at least one review.
  • Other top US review sites include Google+, Yahoo, Yelp, and TripAdvisor
  • Yelp is the review site with the most global traffic
  • 84% of all consumers read online reviews, reading an average of 4-6 reviews before they begin to trust a business
  • 76% of customers are willing to pay more for hotels with better reviews.

How are you encouraging happy customers to leave reviews?

Online Reviews infographic

For years, Google has had a strong hold on the search industry, maintaining over a 75% market share for the desktop search market. If recent months are any indication however, that grip appears to be loosening.

According to the latest data from StatCounter, Google’s desktop search market share dipped below 75% for the first time since July 2008, continuing a downward trend that started in November.

US Search Share Jan

In November, Mozilla replaced Google with Yahoo as the default search engine on its Firefox web browser. Initially Google didn’t seem to be concerned, but a three month drop in search share seems to be finally getting their attention.

In mid-January Firefox users who visited the Google homepage were greeted with a banner encouraging them to set the search engine as their default. At the same time, Google also began tweeting instructions for how to replace the search engine.

US Search Share Jan Firefox

Since the five-year agreement was made between Yahoo and Mozilla, Yahoo has been consistently gaining ground, already replacing Bing as the second most popular desktop search engine. In total, Yahoo has nearly tripled its share of the desktop search market on Firefox, climbing to over 28% from less than 10% in November.

In the long run, it is still unclear whether Yahoo is going to be able to continue its ascent. While the changes are substantial, Firefox is also the least popular major desktop browser available. The change is search share is also limited to desktop, suggesting users aren’t so much choosing a new search engine but accepting what they are being given.

Despite these challenges, Aodhan Cullen, CEO of StatCounter, says Yahoo is already beating the odds:

“Some analysts expected Yahoo to fall in January as a result of Firefox users switching back to Google. In fact Yahoo has increased US search share by half a percentage point. It will be fascinating to see if these gains continue.”

It will be interesting to see if the trend continues and how Google might try to persuade more users to actively choose their search engine over the default.

Clock

Do you know the fastest way to lose potential customers on your website? You might think it would be by creating a page with poor usability, illegible text, or you could get creative and put offensive images on your front page. No matter your choice, there is something that can lose visitors before they even get the chance to see any of those options – long loading times.

Consumers simply don’t accept having to wait for what someone else can offer faster, and this is especially true online. The average consumer is willing to wait approximately five seconds before they become annoyed or frustrated with being forced to wait. If your site takes longer than that for the average user, it is practically guaranteed you are hemorrhaging visitors who aren’t willing to wait.

Long loading times also hurt your site and loses you visitors in a few less direct ways, most notably in rankings. While there are many things we don’t understand about Google’s ranking algorithm, we do know loading speed is one of the biggest factors in establishing your site’s perceived value and ranking.

So, how do you actually go about speeding up your website’s loading times and increasing its effectiveness? These five tips will help you get started:

  • Minimize on-page components. There are plenty of processes going on behind the scenes that can slow a site down. If you can combine style sheets or replace images with CSS, your site will be able to better load everything in a fast manner.
  • Compress large pages. Google has shown time and time again that sites with long-form content, videos, and shareable media are some of the best ways to rank higher, but all the extra content also means there is more to load. Try to compress your larger pages so they take up less space and consume less bandwidth when they load.
  • Use browser caching. Browser caching stores important elements from your site on a viewer’s hard drive in order to improve load times on repeat visits. A shocking number of webmasters forget to implement this tool, which can lead to slower load times for even your most loyal visitors.
  • Optimize visual content. The growing emphasis on visual content might have misled some website owners. If customers enjoy images, video, and graphics, why not fill your site with them? Unfortunately, too many improperly formatted graphics can cause a traffic jam and sluggish load speeds. Take the time to optimize visual content by limiting size, reformatting images into JPEG, and eliminating BMPs, GIFs, and TIFFs, and viewers will love you.
  • Eliminate unnecessary plugins. Particularly if you’re using WordPress, running multiple plugins contributes substantially to slower page load speeds. Though their convenience and ease of use make plugins an attractive option, using too many will cause your load speed to plummet and result in poor user experience. Remove any plugins you don’t absolutely need.

Over the past year, more than a few people have predicted the death of Facebook. They cite the shrinking number of teens signing up for the social site and the increasing difficulty for brands to get organic exposure as proof the end is near. But, a new report from Shareaholic show Facebook is still going strong.

Facebook has consistently been the leader in social referral traffic for years, and their share of traffic referrals is only growing especially during the last quarter of 2014. In fact, Shareaholic’s data suggests Facebook may be responsible for nearly a quarter of all traffic online.

Social-Media-Traffic-Referrals-Report-Q4-2014-graph

The most popular social media site reached over 25% of the total share of visits to Shareaholic’s network through October and December, however it fell to 24.64% in December. Overall the site gained 2.27 percent since the third quarter.

The report confirms Pinterest’s popularity, as the data showed the site in second place. Still, even Pinterest can’t compete with Facebook’s share of traffic referrals. Pinterest’s share was only 5.06%, nearly five times less than Facebook.

Pinterest_Sticker_Icon1
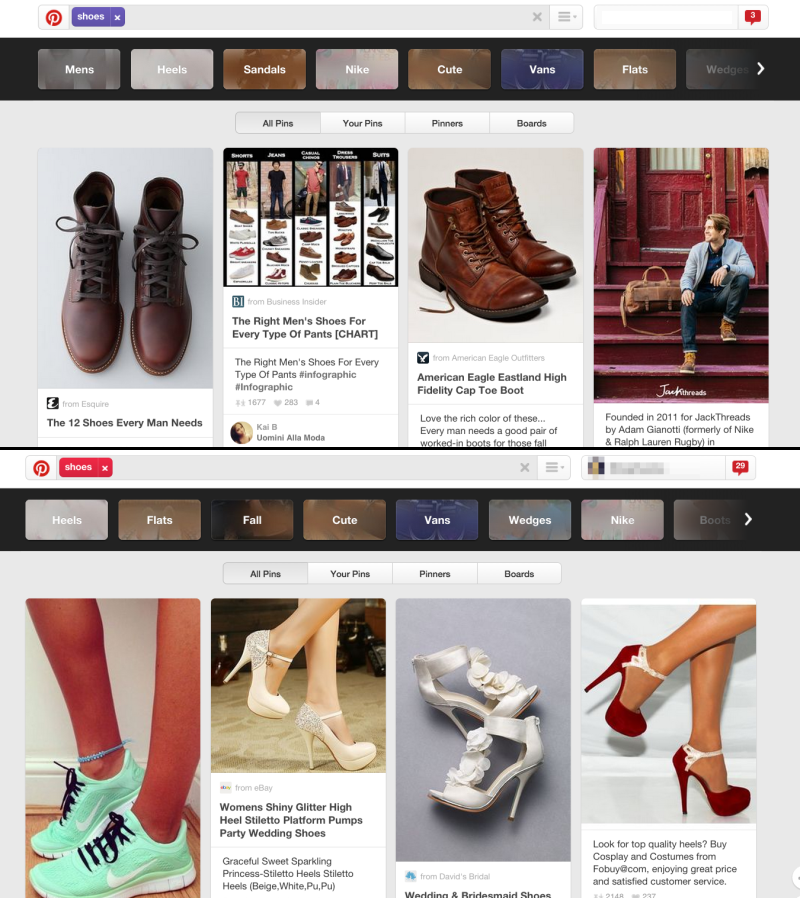
While Pinterest has quickly become one of the most popular social media sites around, it is no secret that the company struggles to attract men. The problem is so widely known, Wall Street Journal profiled the company’s attempts to bring more men onto their site today.

The latest estimates from comScore indicate up to 71% of Pinterest’s 72.5 million visitors in December 2014 were female, and a recent Pew Research survey found that only 13% of American online men use the site. Despite this, Pinterest claims it doubled the number of male users last year, but it still isn’t out of the woods.

Pinterest is currently making strides to increase revenue, which means the company has to convince advertisers it can reach a wide range of demographics – including men. To accomplish that, Pinterest told the Journal that it is working to make the site more “gender neutral” and has adjusted the sign-up process to give new users content-following suggestions based on their gender.

In an attempt to cater the site towards user interests, Pinterest announced a few interesting changes in the article. Perhaps most intriguing is the news Pinterest will begin personalizing search results based upon users’ gender.

For instance, depending on whether a male or female is browsing, a search for “workouts” generates fitness tips that are as different as the pages of “Men’s Fitness” and “Women’s Health.” In the past, the results for male users would have included a mix of men’s and women’s workout regimens. Pinterest says this feature, now available to all of its users, has led to increased engagement on the platform.

Pinterest never mentioned this algorithm in the past, but some tests from Marketing Land show the difference in search results is pretty stark. Here are some examples:

Results for “Party”

PartyResults

Results for “Shoes”

ShoesResults

facbook-advertising
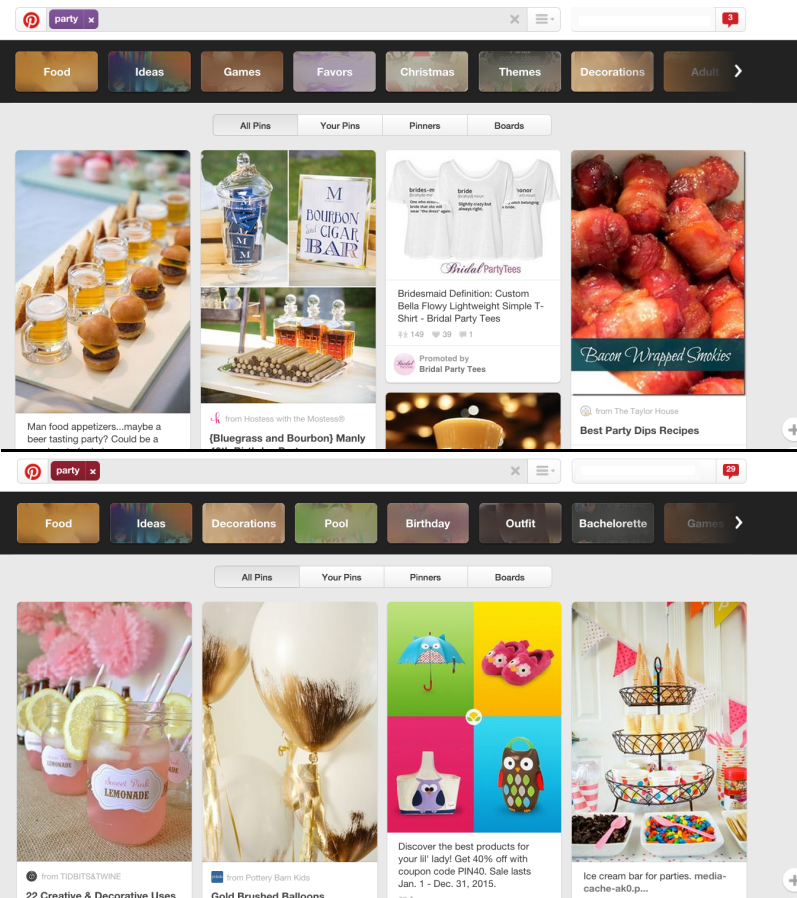
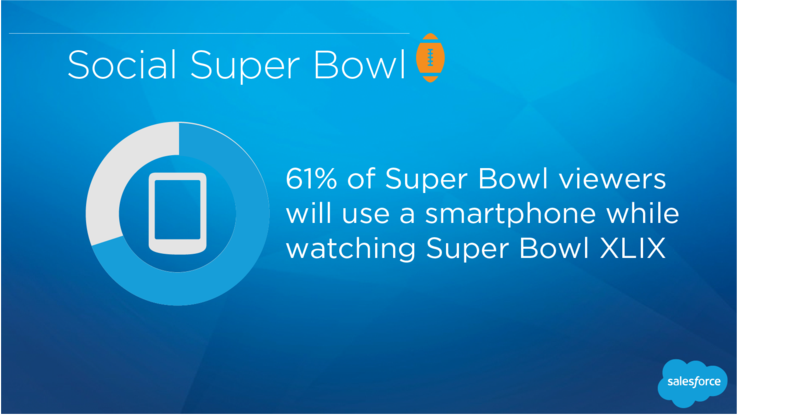
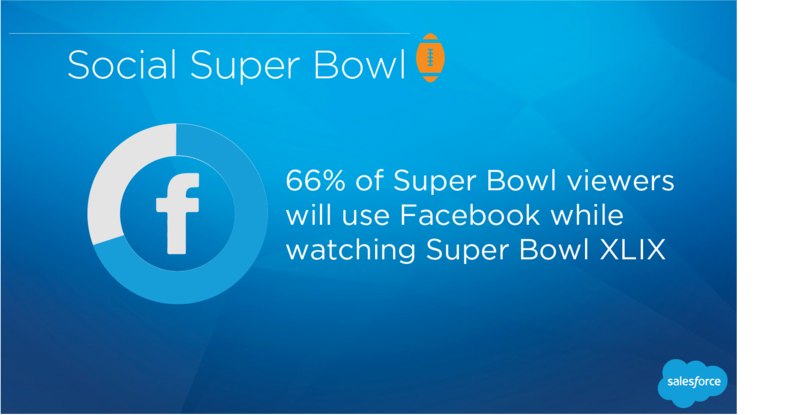
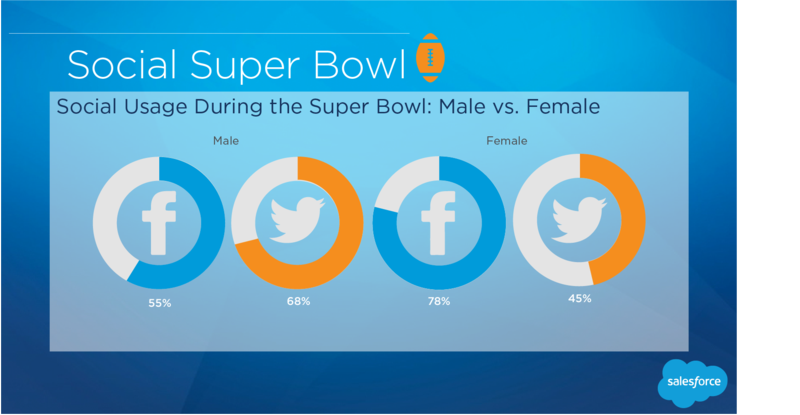
The Super Bowl is quite possibly the biggest single day for advertisers. There aren’t many other times you’ll hear anyone proclaim they are watching something “just for the commercials.” But, it has always been difficult for online marketers to get into the mix. That all might be changing as Facebook has announced a new tool to help online advertisers target people interested in the “Big Game.”

The “Big Game” targeting segment allows advertisers to reach people specifically based on real-time online discussions related to the Super Bowl.

According to the announcement, the segment will go much further than simply targeting football fans. The “Big Game” segment will also include those liking, commenting, and sharing content related to party planning, recipes, or even flatscreen TV purchases in the days leading up to XLIX.

The targeting tool is also designed to be updated frequently, so that ads will be directed based on up-to-date information.

The new tool is a change of strategy for Facebook, who used interests and liked pages to target ads last year.

According to the social media platform, combining ads with live sporting events is a highly effective strategy for reaching specific targeted demographics. For example, it cites a cross-platform Nielsen study that analyzed at a Microsoft commercial that was shown during the 2014 Super Bowl and found Microsoft was able to reach 35% of persons 18 to 49 in the United States during a four-day run of the TV spot.

Using Facebook ads during this campaign allowed Microsoft to extend that reach to 57% of the national target of people 18-49. Among the younger 21 to 24-year-old audience, Microsoft more than doubled its reach, extending its TV reach of 24% to a combined TV-plus-Facebook reach of 53%.3.

The new targeting segment is available starting today for all advertisers. It can be found in the Facebook ads interface within the “Behaviors” section, under the “Seasonal and Events” category.