Bing Uses An Infographic to Sum Up Their Past Year in Search
As part of their year-end wrap up, Bing posted some of their highlights from the past year in the form of an infographic on the Bing Search Blog. The infographic summarizes some interesting facts and statistics from 2013 that mostly puts a spotlight on their recent growth. But, there are some parts of the infographic marketers and business owners might take interest in.
 For one, you have probably heard how important social media is to establishing a brand online and engaging internet users, but you might not know that Bing is often more attentive to social media than Google. While Google’s rankings may factor in social media data for website owners, actual users see very little social media presence outside of YouTube and Google+.
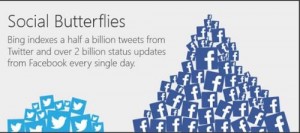
Meanwhile, Bing has been actively attempting to make Twitter and Facebook a significant part of their search engine. According to their end of the year stats, Bing indexes up to half a billion tweets from Twitter every day and over 2 billion Facebook status updates every single day. You might keep that in mind when considering which search engine you want to cater your social media efforts to.
You might also be surprised by where Bing is being used. Google is almost ubiquitous with web search, but you use Bing more often than you might think. The search engine is used on Facebook, Yahoo, Siri, and even some Android devices.
Other facts from the infographic include:
- If everyone that sees the Bing Home page image each month were to hold hands, they could form a human chain stretching around the circumference of the Earth.
- Search activity on Bing Video more than doubled in 2013.
- If you were to line up even just 5% of the pixels that make up Bing Maps, you could make four round trips to Venus with trillions of pixels to spare.
- It would take 150 years to watch the 800,000 films indexed by Bing.
The infographic is below:


Leave a Reply
Want to join the discussion?Feel free to contribute!