As part of their year-end wrap up, Bing posted some of their highlights from the past year in the form of an infographic on the Bing Search Blog. The infographic summarizes some interesting facts and statistics from 2013 that mostly puts a spotlight on their recent growth. But, there are some parts of the infographic marketers and business owners might take interest in.

Bing Social GraphicFor one, you have probably heard how important social media is to establishing a brand online and engaging internet users, but you might not know that Bing is often more attentive to social media than Google. While Google’s rankings may factor in social media data for website owners, actual users see very little social media presence outside of YouTube and Google+.

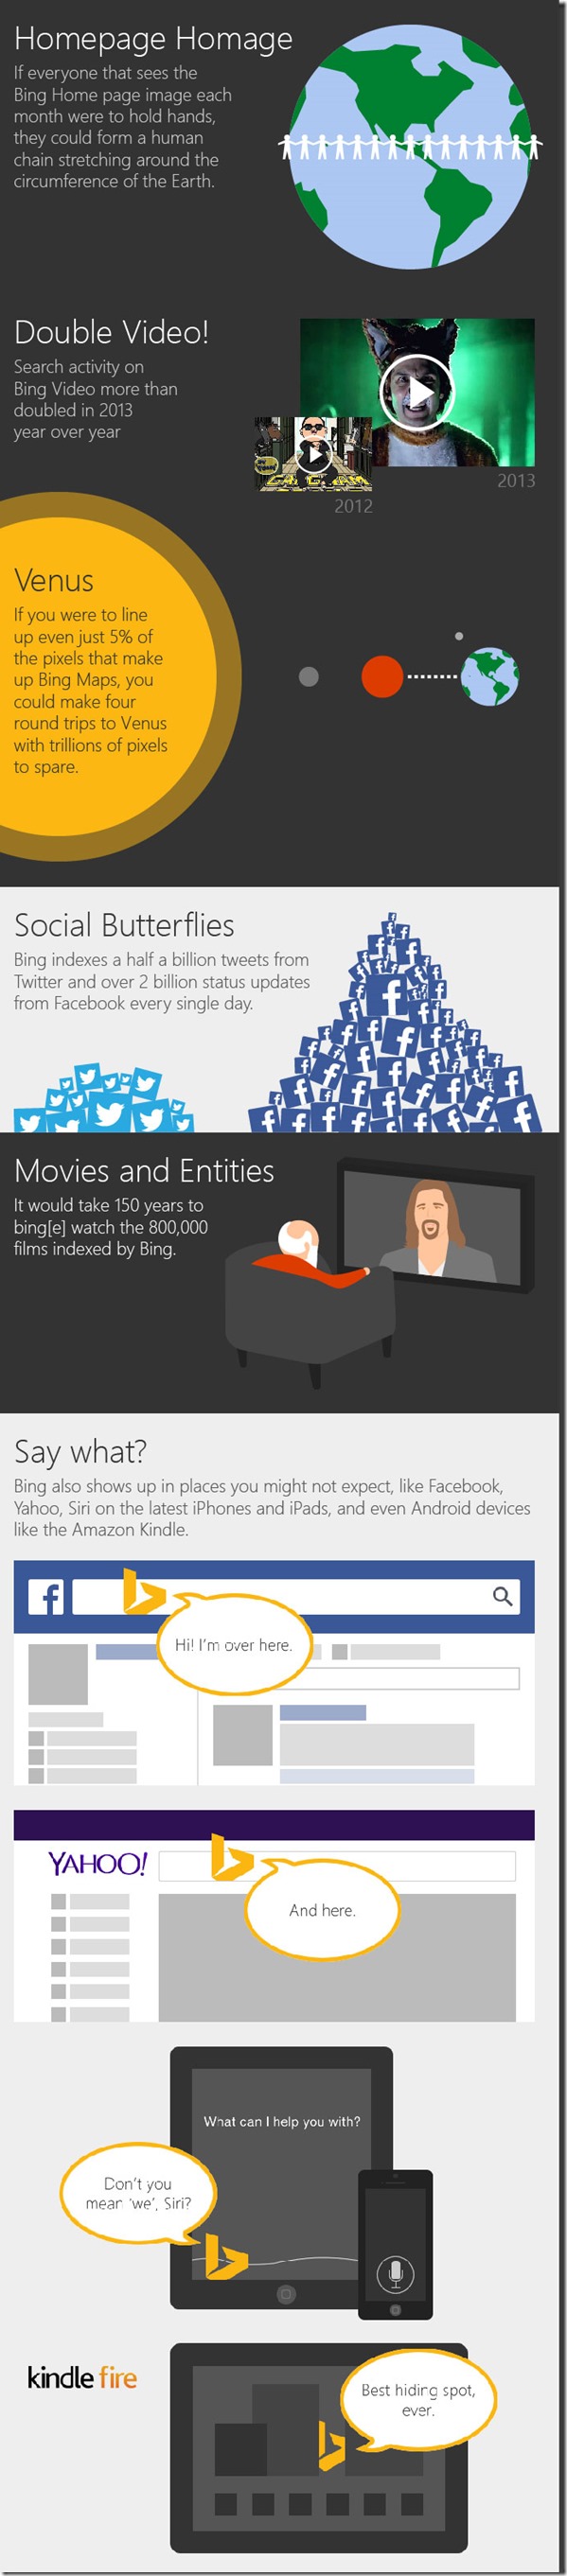
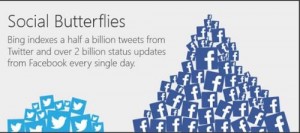
Meanwhile, Bing has been actively attempting to make Twitter and Facebook a significant part of their search engine. According to their end of the year stats, Bing indexes up to half a billion tweets from Twitter every day and over 2 billion Facebook status updates every single day. You might keep that in mind when considering which search engine you want to cater your social media efforts to.

You might also be surprised by where Bing is being used. Google is almost ubiquitous with web search, but you use Bing more often than you might think. The search engine is used on Facebook, Yahoo, Siri, and even some Android devices.

Other facts from the infographic include:

  • If everyone that sees the Bing Home page image each month were to hold hands, they could form a human chain stretching around the circumference of the Earth.
  • Search activity on Bing Video more than doubled in 2013.
  • If you were to line up even just 5% of the pixels that make up Bing Maps, you could make four round trips to Venus with trillions of pixels to spare.
  • It would take 150 years to watch the 800,000 films indexed by Bing.

The infographic is below:

Bing Year End InfographicaQQQQQQQQQQQ

Local SEO Infographic Banner

It constantly surprises me how many local businesses don’t believe in investing in proper online marketing and optimization. Given, I see every day how establishing a quality online presence and optimizing it for higher visibility can benefit a business. Still, many local businesses hold the conception that online marketing is only important for national level businesses, and they couldn’t be more wrong.

Current estimates say that more than 2.6 billion local searches are conducted every month. More importantly, statistics show that these local searchers are becoming more and more mobilized to quickly go from search to purchase thanks to the use of smartphones to search on the go. Nearly 86 million people are regularly using their mobile phones to look up local business information, and these searchers are highly primed to convert. Simply put, without an online presence and the optimization to make your brand visible you are missing out on a large chunk of potential customers.

Hubshout recently created an infographic to illustrate how important local search engine optimization (SEO) really is for your business. Not only does the infographic show what you are missing out on by neglecting your online presence, it also shows how many many businesses have yet to establish themselves online in a meaningful way. There is still a lot of untapped opportunity online, you just have to make the leap.

Local SEO Infographic

Source: Hubshout


Just a few years ago it would have been impossible to imagine how much social media has grown and become a part of our lives. Even during the heyday of Myspace and the rise of Facebook, no one could have predicted the sheer number of social media apps and websites available and popular these days. We tweet out our random thoughts, we Instagram our pictures, and using the right social media platform for your market can even help you get a job.

The big news is that social media is not slowing down. With the app store flooded by social media apps, you would think their popularity would begin to wane, but social media continues to grow in just about every market. It isn’t a fad. Social media is a part of our lives.

Just over 2 years ago Search Engine Journal published an infographic called the Growth of Social Media. Looking at the infographic now is practically nostalgic as it lists tons of platforms that have fallen entirely off the map, and it reminds us how quickly Pinterest, Reddit, and all the current sites flourished. But, the graphic is woefully out of date.

That is why SEJ decided to update their graphic to reflect the state of social media today. No surprise, the numbers are even better now than they were before. You can see version 2.0 of The Growth of Social Media below, and the original version is still available at their site.

Growth of Social Media Infographic


Creating a website that works well on the huge range of devices is no easy task. In fact, creating a website with a solid user experience on every device being used to access your site may actually be impossible. You have to account for a variety of screen sizes, creating a site that loads quickly enough to keep a user from losing interest, and the fact that no everyone has the newest devices for browsing the web. In fact, many are using devices that are quite outdated, which can be an issue for modern designers.

Responsive design is the popular solution for these problems, but it isn’t a magic fix. Responsive design methods certainly make it easier to account for the huge range of devices connecting users to information, but without relentless testing and tweaking there will invariably be a few devices which run into problems accessing your website.

However, responsive design is still the best current solution for these issues. Your only real alternative solution is creating different websites for mobile and desktop users, but this still requires massive amounts of testing to make these sites usable for every device. It makes more sense to do all that work towards a single site, rather than two.

As Marianna Gallano explained, the most common approach to responsive design is to split pages into multiple elements, such as the header, image galleries, and product descriptions. Each element stands on its own in terms of functionality, but seamlessly transfer their look and user experience to various devices and screen sizes. This way, images are able to automatically scale and resize, while text always stays legible, even on the relatively small screen of a smartphone.

WhoIsHostingThis, a site covering news for webmasters and webhosting, created an infographic to break down what responsive design really is, why it is so important, and how each element of a site functions within the whole while responding to a variety of screen sizes.

If you’ve spent much time online in the past year or two, it is almost certain you’ve come across an infographic. They are highly enjoyed by the public, as well as being educational. This is why more companies and content creators are using infographics to communicate and share knowledge with the public than ever before. Some may say it is just a trend, but either way the data shows that searches for infographics have risen over 800 percent in just two years, from 2010 to 2012.

Even if you don’t know what an infographic is, the chances still favor that you have seen one either in your Facebook feed, a news article, or maybe even your email. Infographics are images intended to share information, data, or knowledge in a quick and easily comprehensible way. They turn boring information into interesting visuals which not only make the information easier to understand, but also make the average viewer more interested in what is being communicated.

According to Albert Costill, multiple studies have found that 90 percent of the information we retain and remember is based on visual impact. Considering how much information take in on a day to day basis, and that means you’re content should be visually impressive if you want to have a hope of viewers remembering it. If you’re still unsure about infographics, there are several reasons you should consider at least including them occasionally within your content strategy.

  1. Infographics are naturally more eye-catching than printed words, and a well laid-out infographic will catch viewers attention in ways standard text can’t. You’re free to use more images, colors, and even movement which are more immediately visually appealing.
  2. The average online reader tends to scan text rather than reading every single word. Infographics combat this tendency by making viewers more likely to engage all of the information on the screen, but they also make it easier for those who still scan to find the information most important to them.
  3. Infographics are more easily sharable than most other types of content. Most social networks are image friendly, so users are given two very simple ways to show their friends their favorite infographics. Readers can share a link directly to your site, or they can save the image and share it directly. The more easily content can be shared, the more likely it is to go viral.
  4. Infographics can subliminally help reinforce your brand image, so long as you are consistent. Using consistent colors, shapes, and messages, combined with your logo all work to raise your brand awareness. You can see how well this works when you notice that every infographic relating to Facebook naturally uses “Facebook Blue” and reflects the style of their brand.

Obviously you shouldn’t be putting out an infographic every day. Blog posts still have their place in any content strategy. Plus, if you are creating infographics daily, it is likely their quality will suffer. Treat infographics as a tool that can be reserved for special occasions or pulled out when necessary. With the right balance, you’ll find your infographics can be more powerful and popular than you ever imagined.

If you have been reading up on SEO, blogging, or content marketing, chances are you’ve been told to “nofollow” certain links. If you’re like most, you probably didn’t quite understand what that means, and you may or may not have followed the advice blindly.

But, even if you’ve been using the nofollow tag for a while, if you don’t understand what it is or how it works you may be hurting yourself as much as you’re helping.

The nofollow tag is how publishers can tell search engines to ignore certain links to other pages. Normally, these links count similar to votes in favor of the linked content, but in some circumstances this can make search engines think you are abusing optimization or blatantly breaking their guidelines. Nofollowing the right pages prevents search engines from thinking you are trying to sell you’re influence or are involved in link schemes.

To help webmasters and content creators understand exactly when to nofollow, and how it affects their online presence, the team from Search Engine Land put together an infographic explaining when and how to use the tag. They also created a comprehensive guide to the tag for those who prefer long walls of text to nice and easy infographics.

Keeping up with the local search ranking algorithm can often be at best confusing and at worst a complete mystery. It seems there are just as many, if not more factors involved, yet less coverage of exactly what search signals Google is using for local businesses. That can make it very difficult to know where to put your focus.

There are so many places you could put your energy too. Should you focus on the completeness of your Google Places profile? Or maybe citations and reviews are more important? Is your business hurt just because it isn’t near the center of the city? All of those are considered, and that is just skimming the surface.

While Google probably isn’t going to be delivering definitive answers about their search algorithms any time soon, David Mihm and Moz are working to find the answers with an annual survey focusing on local search ranking factors. They released their report of their findings for the year already, but Doublespark took their concise results and turned them into an infographic.

Local SEO Ranking Factors

Social media has gone from internet oddity to one of the strongest tools in an online marketer’s toolbox. These days, social media presence can be just as important to your online marketing as your website. In some markets, social presence can be even more vital.

Many companies have already stepped up the the plate to meaningfully incorporate social media marketing into their brand experience, and they’ve found that the tactic can be a serious powerhouse for marketing at a fraction of the cost of many campaigns. The trick is knowing exactly how to use the medium.

The successful marketers on social media aren’t yelling about their products at every turn, they aren’t taking part in silly novelty marketing attempts (Chipotle’s recent Twitter “hacking” …), but most importantly they aren’t ignoring their customers. Social media creates a brand new opportunity for consumers to directly interact with the brands they purchase and create a real relationship between businesses and their audience.

Social media is new, and the companies finding success are experimenting and taking advantage of the real benefits the platforms provide, but they aren’t playing completely by ear. There may not be a rule book set in stone for social media marketing yet, but there are definitely some guidelines.

MarketingProfs tried to tie down some of these guidelines and guiding traits of successful social media marketers, and they put the results into an infographic (seen below). If you’re struggling to find your brand’s voice in the social arena or simply haven’t lept into action yet, this infographic will help you develop a useful approach.

10 Superpowers of Social Media Marketers

ZeroLag Illustrator Shortcuts

Adobe Illustrator is almost as important to web designers and creative professionals as Photoshop. For some, it is even more essential. Most of the veterans probably have every keyboard shortcut memorized, but when you’re getting started it can take quite a while to really get the shortcuts down. Thankfully, the folks at ZeroLag put together a cheat sheet so you can always quickly find the shortcut you need. Before long, you’ll know them like the back of your hand.

Before you can use the cheat sheet, you’ll need the key to understand the image. The grey text show Adobe Illustrator tool shortcuts, while the orange text stands for an action shortcut. The tool shortcuts only require you to press the corresponding key. The orange shortcuts require you to hold the Command key, then press the action shortcut indicated by the orange text.

There are also a multitude of shortcuts not shown directly on the keyboard. Some are listed below on the graphic, but over time you’ll find even more that wouldn’t fit. They are usually found through a combination of the Command or Shift button and a specific letter key.

It can seem overwhelming trying to commit all of these shortcuts to memory, but the ones you use regularly become second nature extremely quickly. For all the others, you’ll save more time by checking the cheat sheet rather than searching through all the menus in the program.


Every brand with a reasonable web presence should be aware of the importance of making your content accessible to the legions of smartphone wielding consumers out there. Nearly everyone has a smartphone now, and mobile web use shows absolutely no signs of slowing down.

But, “going mobile” isn’t exactly an exact science. There are many options for a mobile strategy with pros and cons for each. Of course, at this point the most popular options are building responsively, building a mobile only site, or building a mobile app.

Responsive design takes a bit of a one-size-fits-all approach and relies on the assumption that everyone wants to interact with your content in the same manner, but mobile sites split traffic and create numerous logistical issues. Building a mobile app on the other hand can be an incredible part in establishing yourself on the mobile web, but it simply can’t replace having an actual website.

So how do you decide what approach to take? For most brands, I personally would suggest an approach combining responsive websites and a mobile app, but many companies don’t have the resources to do both as well as they need to be done. That’s when it becomes decision time. To help make the decision, the folks at Web Designer Depot put together an infographic (seen below) to show the facts about mobile design, and going into more detail about the benefits and drawbacks.

To App or Not to App Infographic