Tag Archive for: Google tools

A few weeks ago, Google teased that it planned to refine its PageSpeed Insights tools to make data “more intuitive” and easy to understand. Now, that update has arrived.

What Is The PageSpeed Insights Tool?

If you’re unfamiliar, the PageSpeed Insights tool from Google evaluates your web pages to provide suggestions to improve how quickly content loads. 

The tool has been around in various forms since 2013 when it was a simple API webmaster could use to test their page speeds. Version 5, the most recent major update, arrived in 2018. However, smaller updates like this week’s happen somewhat regularly. 

Along with this new update, Google has moved the PageSpeed Insights tool to a new home at https://pagespeed.web.dev/.

What Is New In The PageSpeed Insights Tool?

The biggest focus of the new update is a change to the user interface to be more intuitive by “clearly differentiating between data derived from a synthetic environment and data collected from users in the field.”

To do this, Google has added dedicated sections for each type of data.

Where the tool used to include a label specifying which type of data you were viewing, Google has instead added information about what the data means for you and how it may be used to improve your performance.

Additionally, Google has shifted its emphasis to data collected from real users by moving field data to the top.

The Core Web Vitals assessment has also been expanded, with a label showing if your site has passed a Core Web Vitals assessment in the field and in-depth metrics from simulated environments.

Importantly, the PageSpeed Insights tool also includes details at the bottom of the page specifying how the data was collected in the field. This information includes:

  • Data collection period
  • Visit durations
  • Devices
  • Network connections
  • Sample size
  • Chrome versions

Lastly, Google has removed the previously included screenshot of the page as it indexed your content, replacing it with a series of images displaying the full loading sequence. 

For more, read the announcement for the update from Google’s Web.Dev blog.

Stories are perhaps the way to share content online these days, so it is only natural that Google has been hard at work preparing its own version of the short-form content. Many users have seen Google Stories in testing throughout its various incarnations, including “Amp Stories” in 2018.

This week, the company officially launched Google Web Stories within its Google app on both iOS and Android devices. 

Google Web Stories can be found in a new carousel shown at the top of the Discover tab, presenting several short video, photo, or audio posts from users and publishers around the world. 

When clicked, stories will expand to a full-screen view where users can click through to your website or swipe to the next story in the carousel. 

Brands and publishers will also be able to monetize, host, share, and add links to their Stories with integration for WordPress, MakeStories, and NewsroomAI. You can even manually code a Google Web Story entirely from scratch. 

6 Rules For Making Google Web Stories

Along with the official release of Google Web Stories, the company has published a set of rules for the format. According to the guidelines, also Stories including the following types of content are prohibited:

  1. Copyrighted Content – Overall, Google is taking a relatively loose stance with what types of content can appear in Stories, especially with regards to copyrighted content. Specifically, the company says it “may” remove content that infringes on an existing copyright or links to a webpage with similar issues. 
  2. Too Long – Google is designing its Stories specifically with short-form content in mind, as such, it may block longer content. To ensure your Story gets shown, keep text down to 180 words or less, and videos a maximum of 60 seconds long. 
  3. Low Quality – You don’t need to have expensive cameras and high-end lighting to create a Story, but you do need at least a smartphone with a decent camera. Videos or images with large amounts of pixelation or distortion are prohibited. 
  4. Lack of Narrative or Theme – Google Web Stories are expected to be just that – “Stories.” They should have a narrative or at least a general theme as users go from page to page. 
  5. Incomplete Stories – While you can link to your site at the end of a story, Google warns against making users click through your site to see the entire content. Your Web Stories must be a complete package on their own.
  6. Overly Commercial Content – Brands can publish Web Stories and even convert some display ads to the format. However, the content must still provide a story or message. Content that is entirely commercial (i.e., being a simple billboard-style ad) is not allowed within the format.

Even before the COVID-19 pandemic, consumer behavior was prone to shifting quickly. Now, it seems buyers’ needs are changing daily – if not hourly. If there is any place this is reflected, it is in our Google searches. 

Product and purchase-related searches have been rapidly evolving as people respond to the daily updates related to the pandemic and their state’s handling of the situation. To help businesses track these changing needs and consumer behaviors, Google is launching a new tool called Rising Retail Categories.

“We’ve heard from our retail and brand manufacturing partners that they are hungry for more insights on how consumer interests are changing, given dynamic fluctuations in consumer demand,” said the company in the announcement.

“That’s why we’re launching a rising retail categories tool on Think with Google. It surfaces fast-growing, product-related categories in Google Search, the locations where they’re growing, and the queries associated with them.”

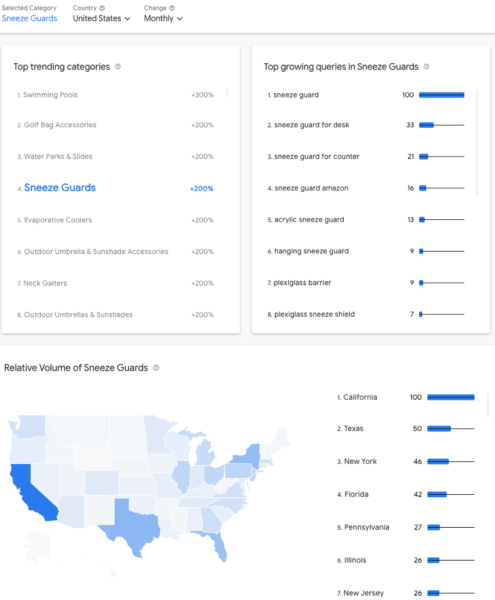
Specifically, the tool shows the biggest shifts in product-centric search categories, as well as their associated queries and the locations where the product categories are showing making the biggest waves on a weekly, monthly, or yearly basis.

The company also says “this is the first time we have provided this type of insight on the product categories that people are searching for.”

Currently, the Rising Retail Categories tool includes data for the US, UK, and Australia.

In the announcement, Google suggested a few different ways the information could be helpful for brands, including content creation, product promotion, and even the development of new products. 

While Google is never going to reveal their “secret recipe” that is used to rank the billions and billions of web pages around, the company still wants to help you ensure your site is performing as well as possible.

To help with this, Google has launched a new tool designed to evaluate your website and rate how it follows the company’s SEO best practices and guidelines.

The tool is currently in open beta, but is available to all webmasters at web.dev.

According to the search engine, the tool is the end result of more than 10 years of learning and iteration.

“As the bar for high-quality experience continues to rise, users are quickly disappointed in a web experience that doesn’t deliver. And then they’re gone.

“We believe, however, the web now has the capabilities to overcome that challenge—to give all users the best possible experience wherever they are.”

The most useful part of the tool for most webmasters will be its SEO assessment, but it also includes audits for performance, accessibility, and more.

Specifically, web.dev can evaluate a website’s:

  • Performance: Audits for metrics like first paint and time to interactive to determine lag.
  • PWA: Assesses your page against the baseline Progressive Web App Checklist.
  • Best Practices: Looks for everything from HTTPS usage to correct image aspect ratios.
  • SEO: Checks for best practices to ensure your site is discoverable.
  • Accessibility: Checks for common issues that may prevent users from accessing your content.

All you have to do to evaluate your own site is enter the URL.

Along with some simple images rating your site’s performance, you will also be given a list of recommended improvements you can make, listed in order of how important they are. The recommendations at the top of the list will have the biggest impact on your site, while those at the bottom as more minute changes that will have little effect on your ranking – though they may improve your site’s overall performance.

Web.dev also provides detailed downloadable reports which can be printed or digitally shared with site owners, providing an easy-to-understand breakdown of your site’s performance on Google.

The tool generates an up-to-date report on a daily basis, so you can also quickly see how any changes you make affect your site’s performance.

Google has been banging the drum for speeding up mobile websites for what seems like forever now, and they’ve released numerous tools to try to help webmasters do just that. This week, at the Mobile World Congress in Barcelona, the search engine announced two more resources to show websites how they are performing – a new “Mobile Scorecard” and Conversion Impact Calculator.

The tools present marketers and webmasters with visual-heavy depictions of how their website stacks up to the competition and what they may be missing out on by not being quicker to load pages

Google’s Mobile Scorecard

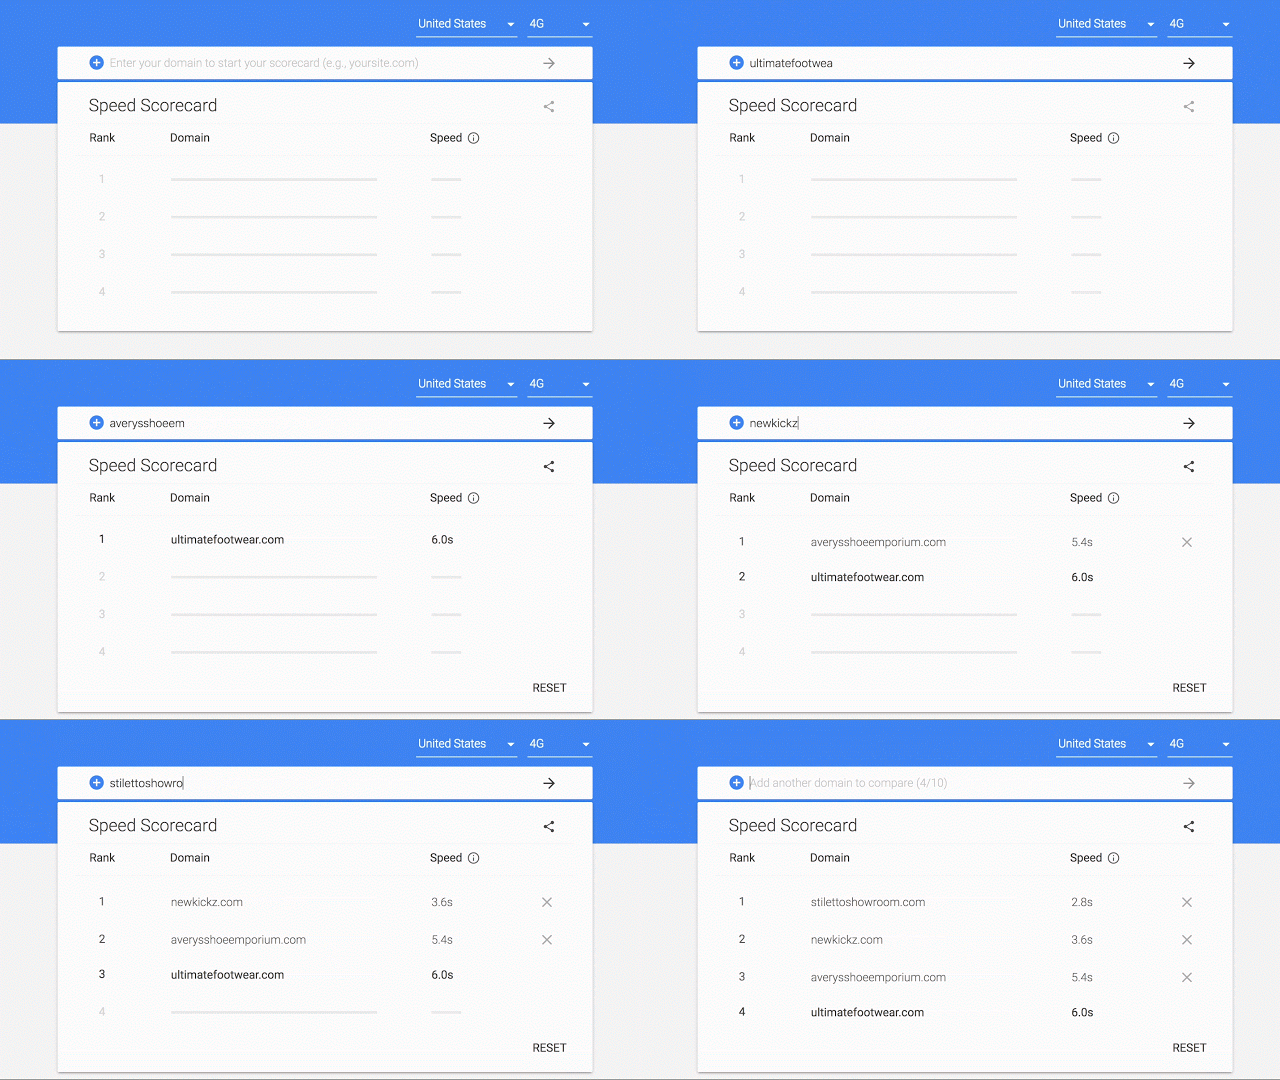
The Mobile Scorecard uses data from the Chrome User Experience Report to compare the speed of several sites on mobile. This allows you to directly compare your site against your closest competitors in a race for the fastest website. According to Google, the Mobile Scorecard can give information on thousands of sites across 12 countries.

Even if you’re the leader of the pack, Google recommends making sure your site loads and becomes usable within five seconds on most mobile devices and within three seconds on 4G connections.

Google Conversion Impact Calculator

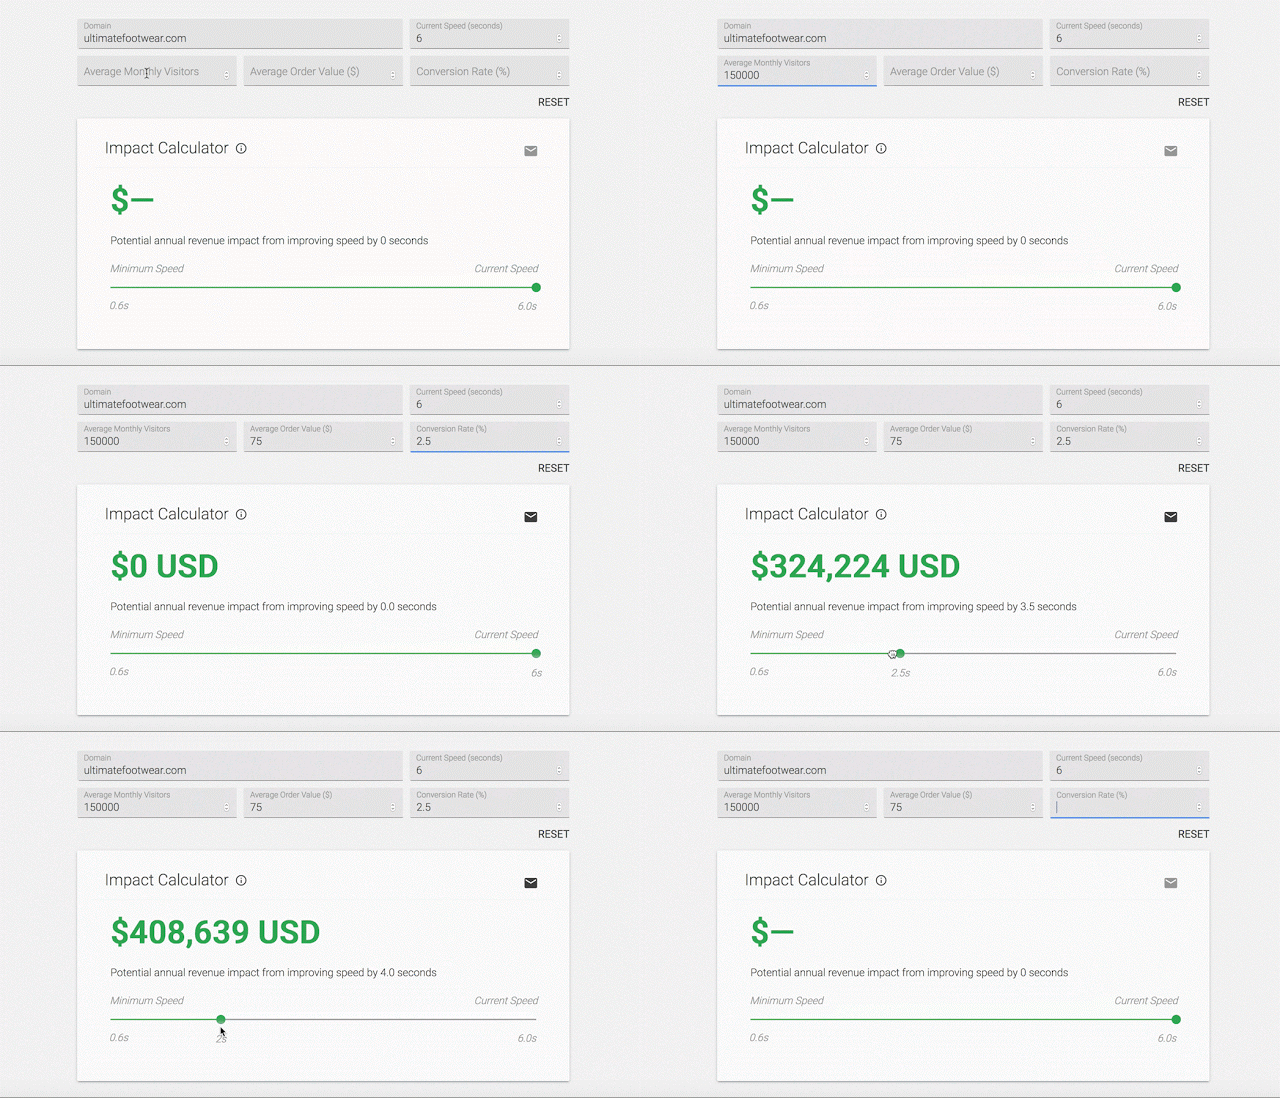
Of course, the biggest thing keeping most businesses from enhancing their websites for mobile devices is money. To help sway you towards making the investment, Google is launching the new Impact Calculator which shows how much revenue you could be missing out on because of a slow loading speed.

The calculator uses data from The State of Online Retail Performance report from April 2017. This report found that every second it takes for your web pages to load can hurt conversions by up to 20 percent.

The tool calculates your potential lost conversion revenue based on your average monthly visitors, average order value, and conversion rate.

Both the Mobile Scorecard and Impact Calculator are available to check out here.

In an increasingly mobile world, the speed of your website can be a major make-or-break point for any business. Estimates suggest most sites lose half or more of their visitors just while their page is loading because people aren’t willing to wait around.

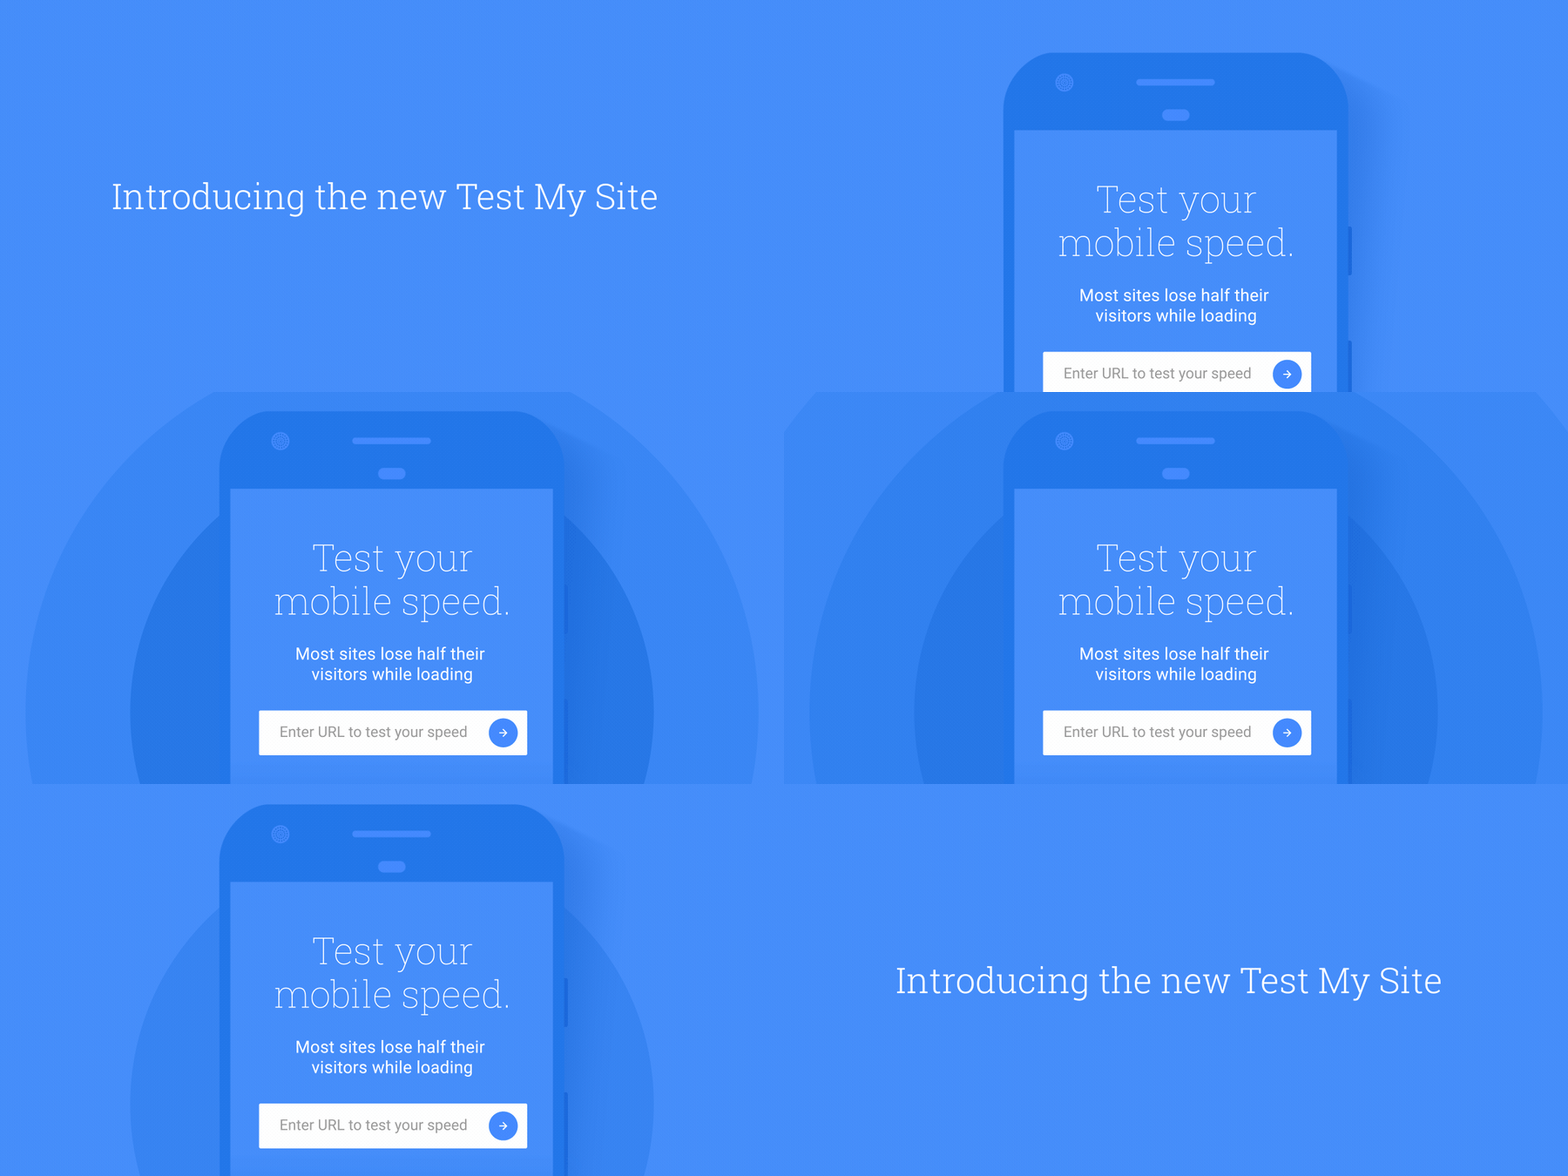
So, how can you fix your site and make it lightning-fast? Google can tell you specifically what you need to do with its Test My Site tool, which just received a new set of features this week.

Now, the tool can tell you a number of things about your site, including:

  • Your site’s mobile speed
  • The number of visitors you may be losing
  • How you compare to the competition
  • Specific recommendations about how to make your site faster

To show just how effective it can be to make your site faster, Google points to a case study from a Nashville fencing company. According to Google, Yard Dog Fence Company managed to double its sales just by following the recommendations suggested by the Test My Site Tool, such as reducing image size.

The days of waiting around for minutes while a website loads are gone. These days, people are likely to leave if your page hasn’t rendered in five seconds or less. It may seem like a tough challenge to speed your site up that much, but the Test My Site Tool will give you an actionable list made specifically for your site. With that as a roadmap, you’ll be able to make the changes you need to supercharge your site, improve your traffic, and increase conversions.

In the wake of the one-year anniversary of the release of AMP (accelerated mobile pages), Google has released a new testing tool to help content publishers ensure their AMP pages are properly set-up and displaying correctly.

The tool is directly available at https://search.google.com/search-console/amp and can be accessed through the Google Search Console.

The testing tool is designed to work on mobile devices and uses Google’s live web-search infrastructure” to assess any AMP page using real Googlebots to provide real-time evaluations.

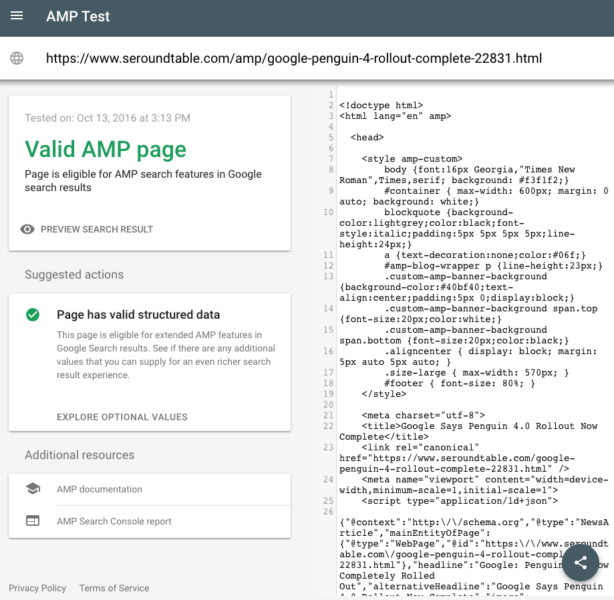
Specifically, it checks the AMP markup and structured data on the page for issues, then highlights any part of the source-code that could be creating errors. You can then click on the issues for more details about the issue.

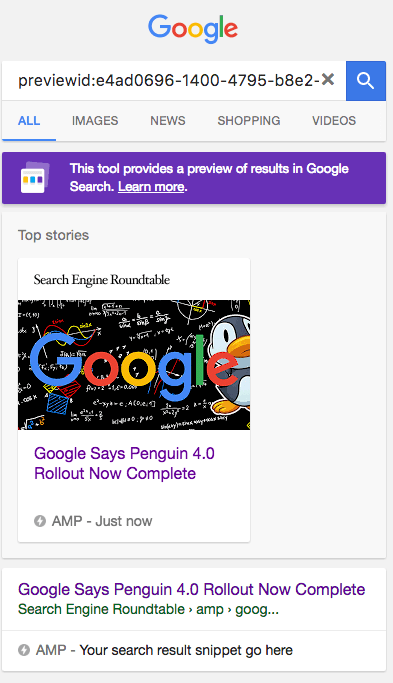
The testing tool also allows you to see a live preview of how the page may appear in Google’s search results.

Below you can see screenshots of the tool in action, taken by Barry Schwartz:

google-amp-testing-tool-614x600

google-amp-preview-tool