It has been a long time coming, but it has finally happened. Mobile has officially overtaken desktop search, according to a new statement from the company.
Informal reports from Google last year indicated it was all but an inevitability that mobile search queries would officially take the lead this year, and Google finally confirmed the news along with a range of new AdWords and Google Display Network announcements.
The company said “more Google searches take place on mobile devices than on computers in 10 countries including the US and Japan,” however it also declined to elaborate what other countries were involved or how recently this shift happened.
Google did note that mobile queries include mobile browser-based searches, as well as those coming from Google’s mobile search apps.
Google did not include tablets with mobile devices, instead choosing to group searches from tablets with those from desktop devices.
The claims have come under fire from some, who are skeptical in the face of contrary data from outside sources. ComScore previously released a report and graphic comparing the volume of US-based search queries across PC, tablets, and smartphones, which showed only 29 percent of total searches were coming from smartphones and tablets in Q4 2014.
If Google’s data is correct, it would imply either ComScore’s was faulty or mobile search experienced an incredible rise over just a few months. For now, that much is unclear because Google is not commenting on the ComScore data.
00Taylor Ballhttps://www.tulsamarketingonline.com/wp-content/uploads/2018/07/TMO-Logo.pngTaylor Ball2015-05-07 15:30:252015-05-07 15:30:25Google Officially Confirms More Searches Come From Mobile Than Desktop
This year is already proving to be a big one for the mobile internet. In the past few months, mobile browsing has overtaken desktop browsing, Google has announced a huge “mobile-friendly” algorithm update, and smartphones are continuing to become even more prominent in American society.
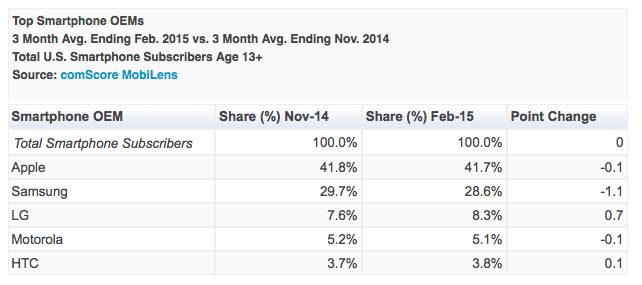
A new report from comScore shows just how common smartphones are in the US, and the numbers are staggering. By February of this year, over three-quarters of all American mobile subscribers now on smartphones, and predictions don’t show any sign of slowing down. By the end of the year, it is possible over 80% will own smartphones.
The findings of the study show some shakeups from previous reports, such as Samsung beginning to lose market share while LG is making gains. Otherwise the findings are relatively flat from last year
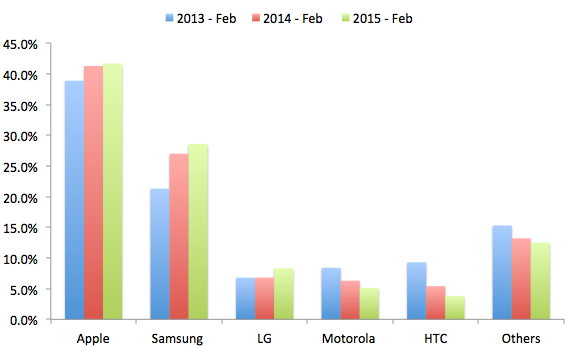
Greg Sterling took the time to graph the latest findings from comScore with those from the past three years, which gives a better perspective of how things have changed in that time. For example, Apple shows modest growth, while other smaller brands are losing share and Samsung shows stagnation.
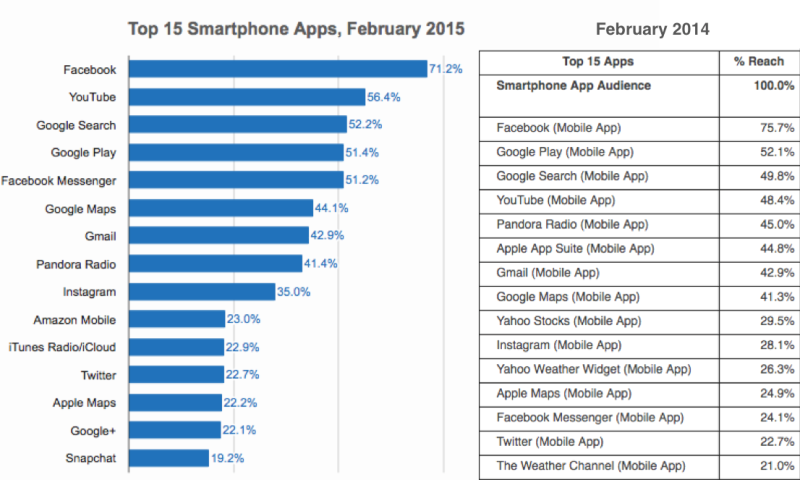
Along with the mobile penetration report, comScore also showed new data on the top apps from February 2014 to 2015. The list is largely similar with previous years, however Yahoo Stocks, Yahoo Weather, and the Weather Channel have been usurped by hot apps like Amazon, Google+, and Snapchat.
00Taylor Ballhttps://www.tulsamarketingonline.com/wp-content/uploads/2018/07/TMO-Logo.pngTaylor Ball2015-04-13 12:13:492015-04-13 12:13:49U.S. Smartphone Ownership Reaches All Time High
As online marketing tries to adapt to smartphones and social media, another burgeoning opportunity to establish a brand is growing. Apps are quickly becoming part of every day life for many people, and a new analysis from Localytics shows that people are spending more time with them than ever. In the past year, time spent with apps has risen 21 percent.
Another recent report from comScore also suggests app usage now makes up more than half of the total time people spend with digital media.
According to Localytics’ report, app session has remained fairly constant since the past year, but users are checking in more often. People are not opening apps 11.5 times per month vs. 9.4 times in 2013.
The question most pertinent to readers is whether an app can benefit your business. That answer depends on a few factors. Even local businesses can benefit from apps if they have a tech-savvy audience and they work in the right industry.
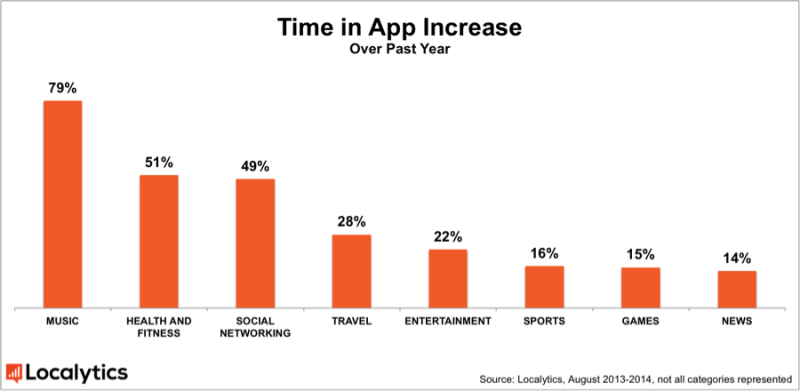
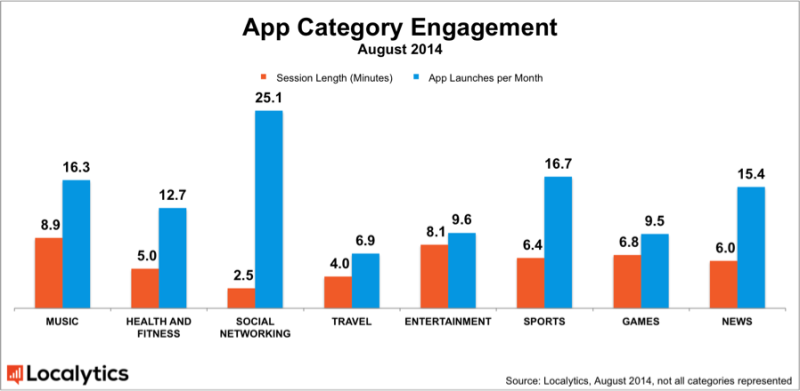
The chart shown above shows which app categories have seen the biggest increases in usage over the past year, while the graph below compares average session length (orange) number of app sessions per month (blue).
Unsurprisingly, social networking apps have the shortest session length, but the highest number of app openings. However the music category saw the most growth in time spent over the past year which shows that users are expecting apps with depth to them in that market.
While the app store may seem to be already flooded with apps, it is clear that smartphone owners are trusting apps more and investing more of their time viewing content through them. But, users are only looking at apps that are relevant to their on-to-go needs and interests.
If you have content or a service that users want on a day-to-day or immediate basis, an app could likely be a smart investment for your brand.
00Taylor Ballhttps://www.tulsamarketingonline.com/wp-content/uploads/2018/07/TMO-Logo.pngTaylor Ball2014-09-16 16:42:582014-09-16 16:42:58Can Your Brand Benefit From an App? This Report May Help You Decide
Every month, comScore releases a “U.S. Search Engine Rankings” report illustrating the market shares of the most commonly used search engines. From month to month the results have stayed largely the same for over a year, with Google taking in almost exactly two-thirds of the market and the other search engines like Bing and Yahoo slowly growing and shrinking by minuscule percentages.
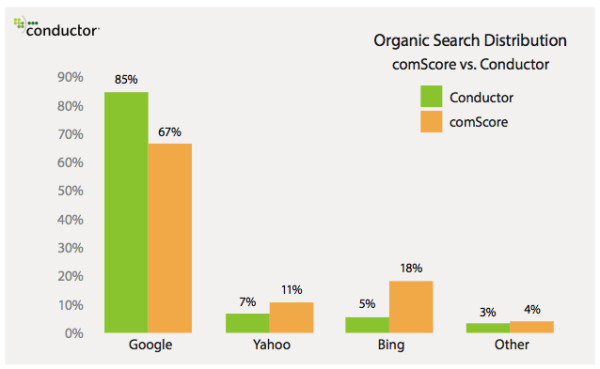
ComScore’s report is widely trusted by most of the online marketing community, but recently analysts from Conductor attempted to challenge comScore’s findings with their own report claiming Google actually rakes in a significantly larger percentage of searches. They even went as far as to title their reports “Why You Shouldn’t Trust comScore’s Numbers for Search Engine Market Share.”
For such an obvious attack on another analytics firm, you would assume Conductor was publishing new information or even comparing the same factors. As Danny Sullivan from Search Engine Land shows in his article reviewing Conductor’s findings however, Conductor’s findings shouldn’t be news to anyone paying attention, and they don’t disprove comScore’s findings.
The issue i that, when people hear that Google controls two-thirds of the search market many publishers assume they should see close to the same proportion of traffic coming from the search engine. Instead, most publishers see significantly more traffic from Google than their market score seemingly indicates.But, market share isn’t a measurement of the traffic sites receive.
The monthly report from comScore reflects the number of actual searches conducted from the major search engines. Most importantly, their report isn’t affected by where the user goes after clicking on a search listing. Sullivan refers to this type of measurement as “before-the-click” behavior. Every search gets counted equally, no matter what the destination is.
Conductor’s analysis instead focuses on “post-click” behavior, or the traffic publishers receive from search engines. In their report, the information that matters most is the post-click activity. If someone does a search and clicks on a link that leads them back into the search engine, it isn’t measured in Conductor’s report.
The discrepancy between these two types of reports isn’t anything new. In fact, Sullivan cites 2006 as the last time it received significant attention due to Rich Skrenta writing that Google’s “true market share” being 70% while most measurement services were estimating their market share at 40%. Most entertainingly, Sullivan’s response then still perfectly explains why a gap might form. So much changes in search on a daily basis it is always noteworthy when something manages to be admirably accurate after eight years. As Danny Sullivan wrote at the time:
“But a search for something on Yahoo Sports? That might be counted as a “search” and it is – but it’s not the type of search that would register with site-based metrics. The searcher might stay entirely inside Yahoo.”
Search engines with the largest gaps favor their own services more than others, which would suggest that Bing’s 13% gap indicates they direct searchers to their own services and platforms more than any other search engine. Surprisingly, Google appears to favor themselves the least, with a -18% gap.
Of course, there is always the possibility that this gap could be created or exacerbated by other factors that may not have been in play at the time. When Sullivan asked comScore for its opinion on the difference between its reports and Conductor’s recent study he was told mobile search could also potentially be an influence. Google has a higher share of mobile search than compared to desktop figures, and comScore’s reports only include data from desktop users.
Both reports serve their own purposes, but both also highlight the same issue. Google has a huge hold on search traffic that should be recognized and planned for. But, those who buy into Conductor’s study may be tempted to ignore the other search engines entirely. To each their own, but my opinion still favors an approach which puts the most weight in Google but doesn’t cut out the other search engines too much.
00Taylor Ballhttps://www.tulsamarketingonline.com/wp-content/uploads/2018/07/TMO-Logo.pngTaylor Ball2014-05-29 13:09:482014-05-29 13:09:48Just How Much of the Market Does Google Actually Control? Making Sense of Conflicting Reports
Bing has been regularly growing its market share over the past year, but don’t think it is at the expense of Google. In June, Bing’s share of all searches went up to 17.9 percent, but it was Yahoo who dropped to 11.4 percent, according to comScore. Yahoo lost exactly as much search as Bing gained, which may not have been what Yahoo CEO Marissa Mayer was hoping for when they signed the search deal with Microsoft.
Earlier this year, Mayer said, “One of the points of the alliance is that we collectively want to grow share rather than just trading share with each other. We need to see monetization working better because we know that it can and we’ve seen other competitors in the space illustrate how well it can work.”
Meanwhile, as Search Engine Watch reports, Google has held steady with exactly two-thirds of the market share, though it is down .1 percent from last year’s June share of 66.8 percent.
In 2012, Bing held 15.6 percent of the market, but they have been making regular gains, almost exclusively at the expense of smaller search engines. Yahoo on the other hand is at an all-time low, down from 13 percent last year.
https://www.tulsamarketingonline.com/wp-content/uploads/2018/07/TMO-Logo.png00TMOhttps://www.tulsamarketingonline.com/wp-content/uploads/2018/07/TMO-Logo.pngTMO2013-07-18 11:32:132013-07-18 11:32:13Bing Continues To Grow While Yahoo Deteriorates