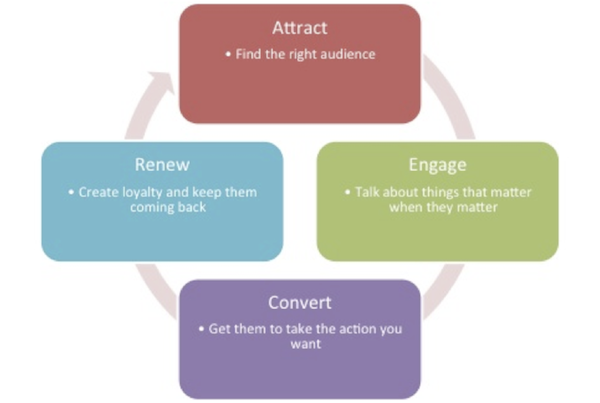
Metrics are an essential part of every online marketer’s life. They are an absolute necessity for knowing exactly how your campaigns are performing and how you can best make improvements. It may be of some surprise however that these metrics can be broken down and separated into four basic lifestyle stages of marketing: attracting, engaging, converting, and renewing. Everyone has their preferences, but Noran El-Shinnawy has some suggestions for the best metrics for each stage in your process.
Stage 1: Attract
- Impressions
In the first stage, it is best to simply let yourself be guided by a set of three questions, metrics aren’t necessarily as important as ensuring your are communicating the right message to your audience. If you can say yes to the following three questions, you’re on the right track.
- Is this the right message?
- Is this the right audience?
- Is this the right time?
For PPC, getting these three questions right relates to how you are handling techniques like keyword choice, targeting, and bidding.
Stage 2: Engage
- Clicks
- CTR
Creating the ads is the fun part of marketing. You get to be creative and finally engaging your creative side of your brain is a welcome relief from data and graphs. The metrics will help you measure how others are relating to your copy, but you can also check out these five tips for writing better ads.
Stage 3: Convert
- Conversion
- Cost
- Cost Per Conversion
- Conversion Rate
- Revenue Per Conversion
- ROI
- Average Position
- Average
- CPC
Most often we find ourselves thinking about ROI purely in terms of dollars and sales. But, not every business benefits from that model. For others, ROI could be better informed by being associated with the value of page views, leads generated, and other such considerations.
Start out by installing a conversion tracking and analytics tools. This will open your eyes to the other possibilities for determining your ROI, while keeping you in-tune with the important numbers like total revenue and advertising cost. If you invest in your metrics, you can make smarter bidding decisions, and keep your focus on the most profitable ads for you.
Stage 4: Renew
- Returning Visitors
- Returning Visitors Revenue
The end phase is where you make improvements and complete the cycle. After the third phase, visitors have two options. They can convert, or they can choose to not convert. In both cases, there is valuable information to be gathered.
If they didn’t convert, investigate and find out what kept them from converting. You can go after them with targeted remarketing campaigns, or you can analyze their path to determine why they weren’t convinced to convert. Was there a technical problem on your site?
Did they not find your products or services compelling? Were your prices too high? Finding out these answers tells you what you need to do in the future.